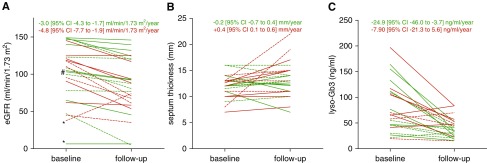
Figure 3.
Antibody saturation due to enzyme excess is associated with better outcomes over time. (A) Change in eGFR. (B) Change of interventricular septum thickness. (C) Change of plasma lyso-Gb3 levels. Green lines: saturated patients with agalsidase excess during infusion. Red lines: not saturated patients with antibody excess (agalsidase deficit) during infusion. Solid lines represent ERT-naïve patients at baseline. * indicates patients excluded for eGFR calculations because of renal transplantation or dialysis. # indicates a patient excluded from eGFR calculation because of newly adjusted renin-angiotensin-aldosterone system blockers. 95% CI, 95% confidence interval.

