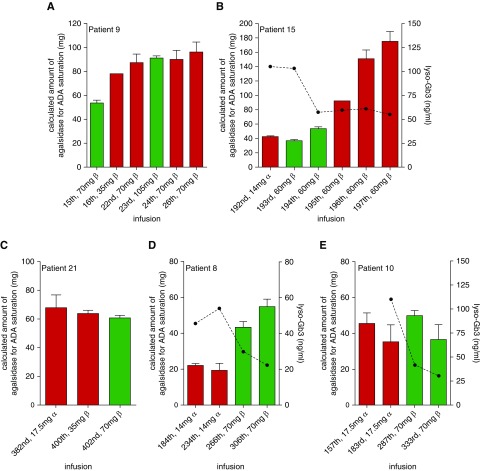
Figure 4.
Dose increase results in antibody saturation but may also trigger further ADA formation. (A) Saturation of ADAs due to dose increase. (B) Short-term effect of dose increase due to switch of product. (C) Effect of dose increase due to stepwise escalation/product switch (396th infusion). (D) Long-term effect of dose increase due to product switch (260th infusion) resulted in increased ADA titers, but titers could be saturated. (E) Long-term effect of dose increase due to product switch (185th infusion) resulted in stable ADA titers, which could be saturated. Green bars indicate saturation (agalsidase excess), red bars indicate no saturation (antibody excess) during infusion. Dotted lines represent plasma lyso-Gb3 levels.

