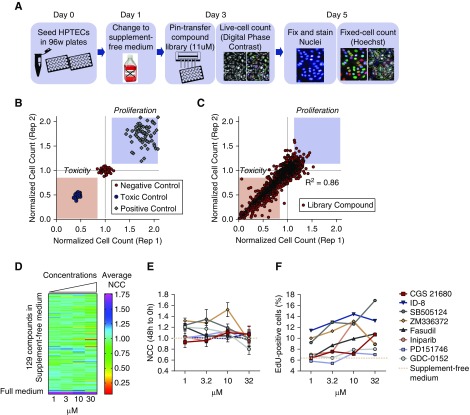
Figure 1.
Screening selects eight potential proproliferative compounds in primary HPTECs. (A) Schematic of the experimental design for the identification of compounds with proliferative potential in primary HPTECs. (B) Control scatter plot shows NCC of positive control (cells maintained in supplemented full medium shown by red squares), negative control (cells maintained in supplement-free medium shown by green circles), and toxic control (cells treated with 0.1 µM digoxin shown by purple circles). (C) Library scatter plot showing NCC of primary HPTECs maintained in supplement-free medium and treated for 48 hours with each of the 1902 compounds of the Selleck library at 11 µM. Blue circles represent library molecules. Blue boxed region indicates zone of increased proliferation. Pink boxed region indicates zone of decreased proliferation and/or cell death. Correlation coefficient of duplicates =0.86. (D) Heat map depicting the NCC of HPTECs maintained in supplement-free medium followed by 48 hours of treatment with the 129 compounds selected in the primary screen, in four concentrations (1, 3, 10, and 30 µM). (E) Detailed dose response curve after 48 hours of treatment with the eight compounds that produced increase in the NCC. Dose response curves compared with cells maintained in supplement-free medium (control). (F) Increase in the percentage of EdU-positive cells after 48 hours of treatment with the eight compounds. Data are represented by mean±SEM of the FC over cells maintained in supplement-free medium (control). n=3 biologic replicates per group.

