Figure 3.
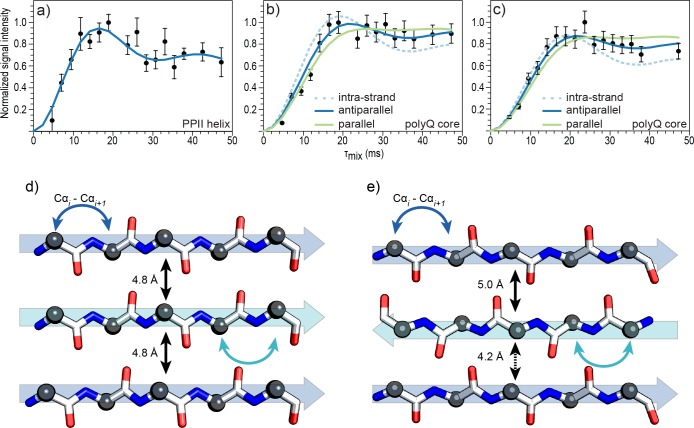
13Cα–13Cα buildup curves for (a) Q44-HttEx1 PPII-helix, (b) Q44-HttEx1 polyQ core, and (c) D2Q15K2 polyQ core. Experimental data (black circles) were obtained by monitoring the buildup of signal intensity of Cα–Cα correlations as a function of DQ mixing time.18,19 In panel a, the blue line is a simulation for a 3.6 Å i – i ± 1 distance in the PPII-helix. Simulations for intrastrand distances (dashed line), parallel β-strand arrangement (green line), and antiparallel β-stand arrangement (blue line) are shown in panels b and c. Canonical backbone conformations of (d) parallel and (e) antiparallel β-strands colored by atom type, Cα (black sphere), C′ (white), NH (blue), O (red). Intrastrand Cαi–Cαi±1 are shown as curved arrows for both types of gln β-strands (blue and cyan). Interstrand distances are labeled with black arrows.

