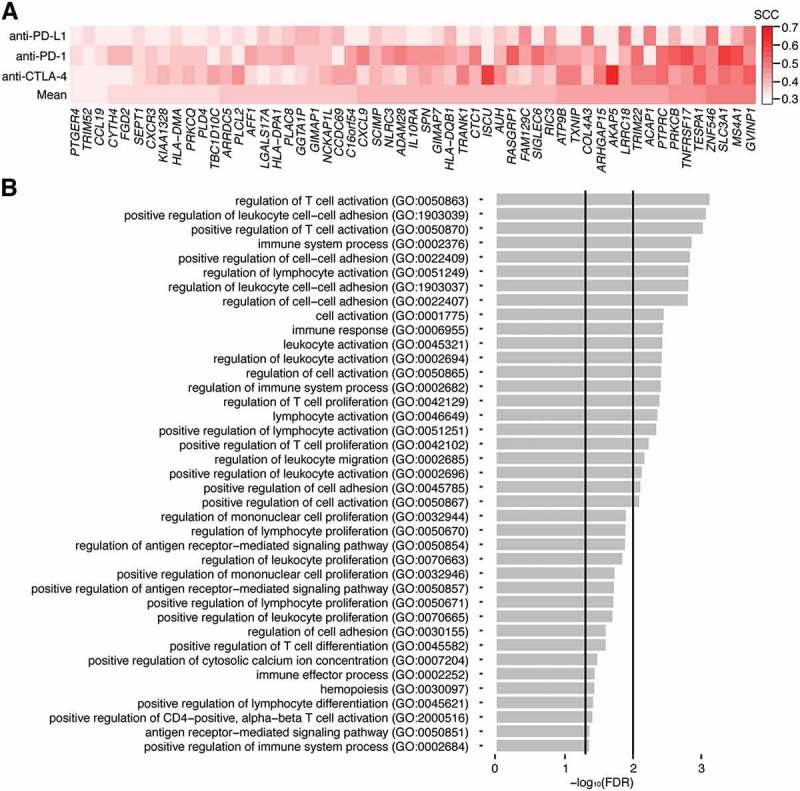
Figure 5.

Gene ontology enrichment analysis for the core MBL signature. A, Spearman coefficients representing the correlation between a dataset’s MBL scores and expression values for the 55 genes of the core MBL signature. Each row represents a different immunotherapy dataset and the mean correlation. Genes are arranged from lowest to highest using the mean correlation. B, False discovery rates (FDR) for the gene ontology (GO) terms most overrepresented in the core MBL gene set. Vertical lines indicate where FDR = 0.05 and 0.01. FDRs were derived from p-values calculated using a Fisher’s exact test.
