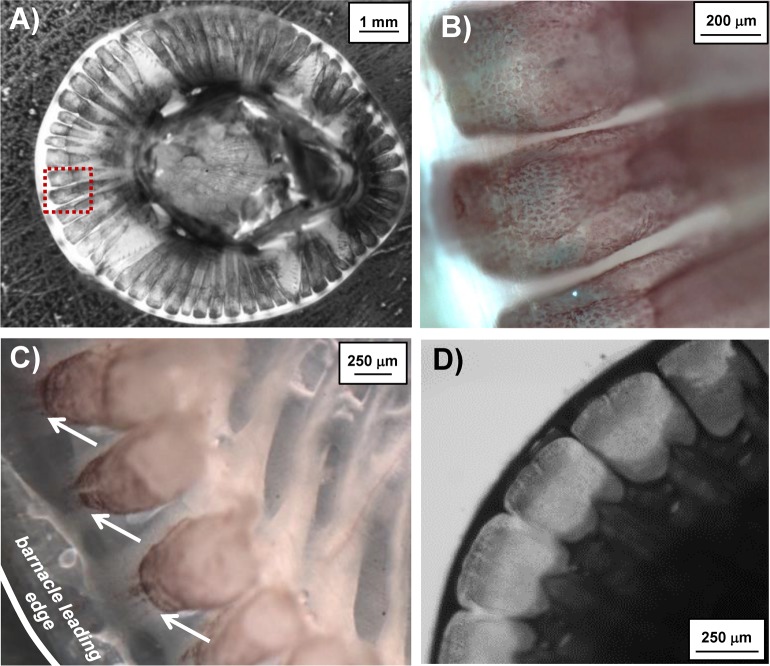
Fig 2. Brightfield images of partially demineralized A. amphitrite and exposed LCT.
A) Top view of partially demineralized A. amphitrite with LCT exposed at the periphery. Dashed red box represents area under higher magnification in panel B), showing greater detail of the exposed LCT including the pink hue arising from the speckled epithelial layer. C) Image of exposed LCT showing their termination into channel-like projections toward the barnacle leading edge. D) Top-down view of partially demineralized A. amphitrite highlighting the longitudinal cavities containing the tissue of interest.

