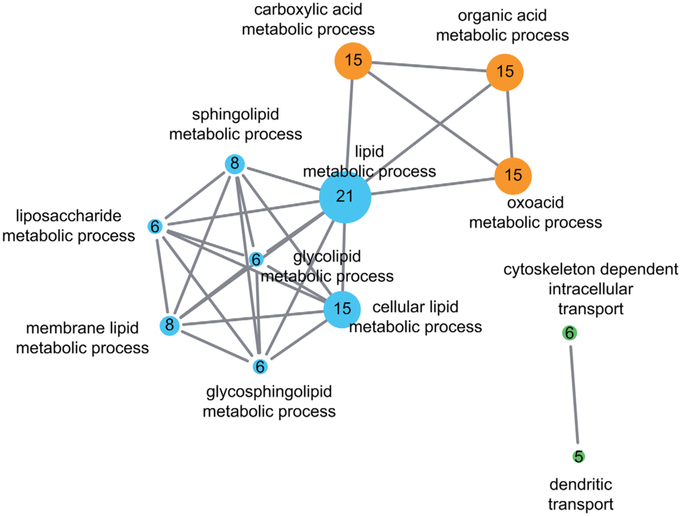
FIG. 3.
Pathway enrichment map of ataxia-HSP spectrum gene sets. Gene-set enrichment analysis reveals several functional clusters associated with ataxia-spasticity spectrum genes. To generate the pathway, enrichment map spastic ataxia genes (Table 1, n = 63 genes; dominant repeat genes excluded) were uploaded to DAVID Bioinformatics Resources 6.863,64 and annotated with gene ontology terms (GOTERM_BP_FAT, GOTERM_MF_FAT).65 The fully annotated gene list is provided in the Supplementary Table. A gene enrichment map was then generated using the Enrichment Map plugin66 in Cytoscape v3.2 with the following parameters: P cutoff, 0.0001; FDR Q cutoff, 0.05; similarity cutoff overlap, 0.4. Three major enrichment clusters can be appreciated: (1) lipid metabolic processes (blue), (2) acid metabolic processes (orange), and (3) cytoskeleton or dendritic intracellular transport processes (green). Each major network contains several subnetworks highlighting a specific cellular process underlying ataxia-spasticity spectrum disease. The size of the nodes reflects the number of ataxia-spasticity spectrum genes represented in the respective functional cluster; the number of genes is also indicated by the number in each of the nodes. [Color figure can be viewed at wileyonlinelibrary.com]

