
Figure 6.
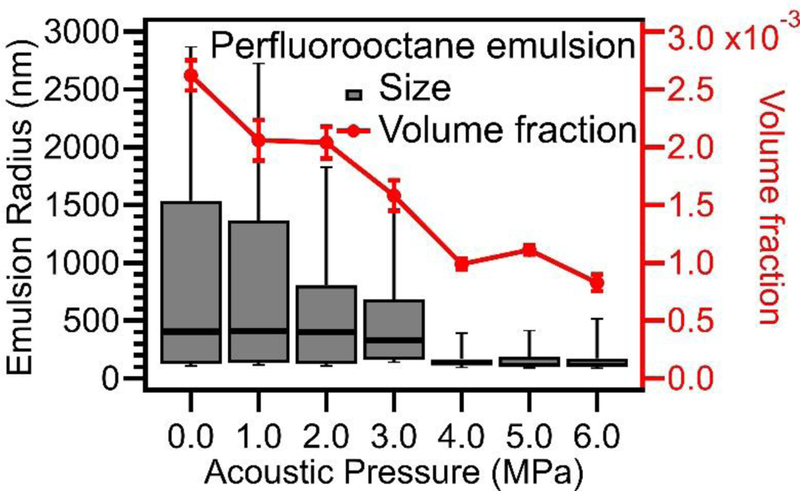
Perfluorooctane emulsion size distribution (box plot) obtained from USAXS modeling showing emulsion size and emulsion volume fraction both decreased with increasing applied acoustic pressures. For the box and whisker plot, the box portion, from bottom to top, represents the 25th percentile, median, and 75th percentile of the distribution. The whisker portion represents the 10% percentile and 90% percentile.