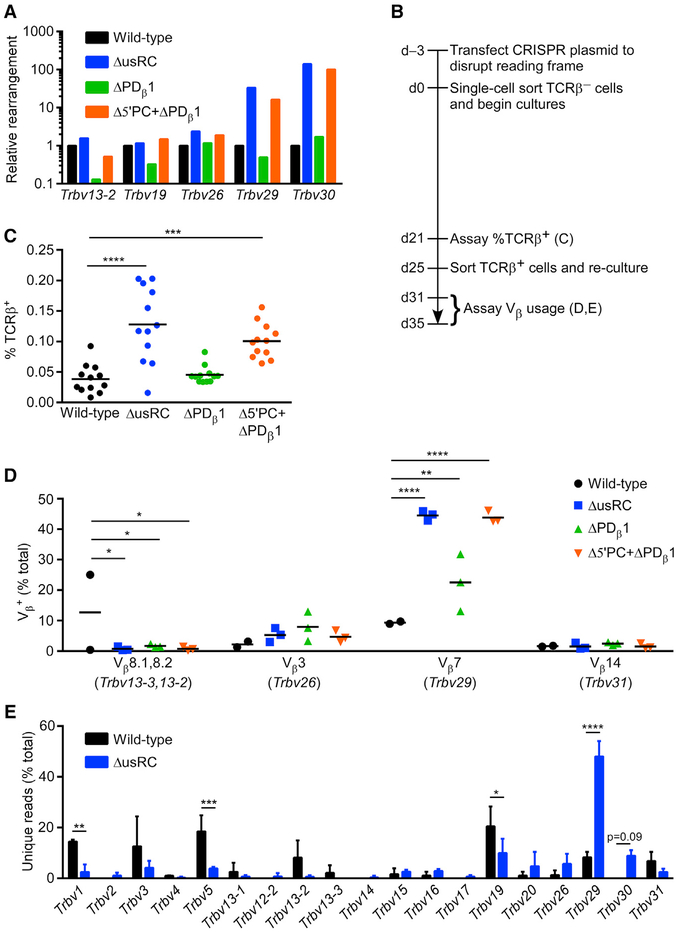
Figure 4. Changes in Tcrb Recombination Frequency and Repertoire upon usRC Deletion.
(A) Relative Tcrb rearrangement in unsynchronized populations of VL3-3M2 cell lines analyzed by qPCR of gDNA. qPCR values were initially normalized to Cd14 in each sample, and normalized values for each Vβ rearrangement in VL3-3M2 mutant cell lines were expressed relative to wild-type, which was set to 1 (n = 1).
(B) Timeline for the disruption of the rearranged allele in VL3-3M2 and its derivatives and analysis of the subsequent accumulation of Tcrb rearrangements in synchronized cultures.
(C) Flow-cytometric analysis of Tcrb recombination in clonal cultures of TCRβ− cells grown for 21 days (n = 12). Horizontal lines denote the mean in each genotype. ***p < 0.001 and ****p < 0.0001, by non-parametric one-way ANOVA with Dunn’s multiple-comparisons test.
(D) Flow-cytometric analysis of Vβ usage in TCRβ+ cells obtained from synchronized cultures of wild-type (n = 2) and mutants (n = 3) by sorting at 25 days followed by expansion in culture. Another wild-type sample in which TCRβ+ cells arose predominantly from an early replacement rearrangement on the rearranged allele was excluded from analysis. Horizontal lines denote the mean in each genotype. *p < 0.05, **p < 0.01, and ****p < 0.0001, by two-way ANOVA with Holm-Sidak’s multiple-comparisons test.
(E) Tcrb repertoire analyzed by high-throughput sequencing of gDNA isolated from TCRβ+ cells analyzed in (D). Vβ usage is plotted as the percentage of unique reads (n = 206 and 209 for wild-type; n = 162, 216, and 240 for ΔusRC) representing rearrangement events on the experimental allele. *p < 0.05, **p < 0.01, ***p < 0.001, and ****p < 0.0001, by two-way ANOVA with Holm-Sidak’s multiple-comparisons test.
See also Figure S2.

