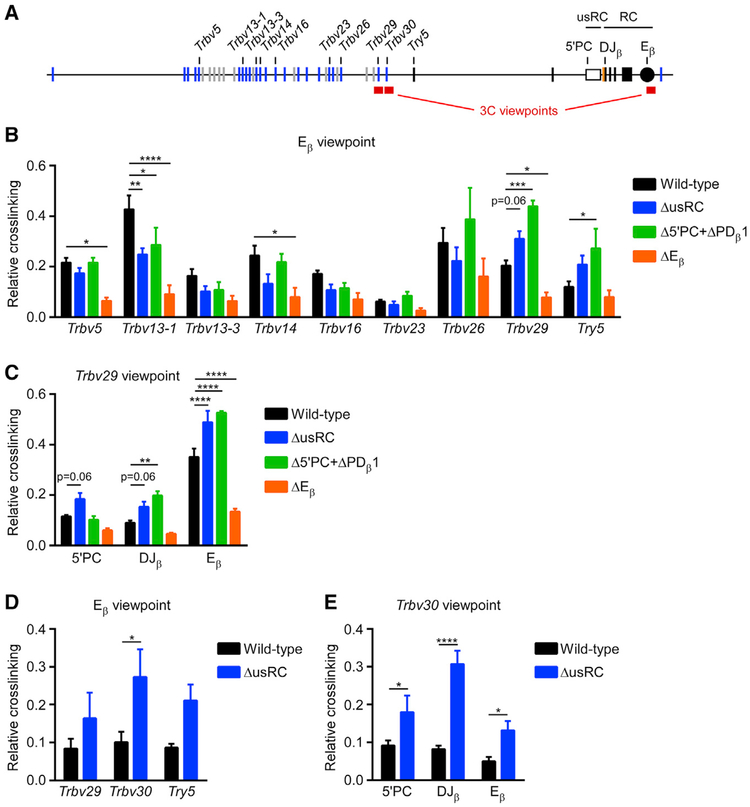
Figure 5. Looping of the RC to RC-Proximal Chromatin Is Suppressed by usRC.
(A) Scale schematic of the Tcrb locus indicating positions of 3C viewpoint and test fragments analyzed.
(B) 3C analysis of long-distance interactions between test HindIII fragments and the Eβ-containing HindIII viewpoint fragment. Results for different ligation products were normalized to their abundance in a digested and religated BAC standard and were expressed relative to the frequency of ligation with an Eβ nearest neighbor fragment. The data represent the mean and SE of five to six independent experiments. *p < 0.05, **p < 0.01, ***p < 0.001, and ****p < 0.0001, by two-way ANOVA with Holm-Sidak’s multiple-comparisons test.
(C) 3C analysis of HindIII fragments with the Trbv29 viewpoint (n = 5–6).
(D) 3C analysis of BglII fragments with the Eβ viewpoint (n = 4–5).
(E) 3C analysis of BglII fragments with the Trbv30 viewpoint (n = 4–5).

