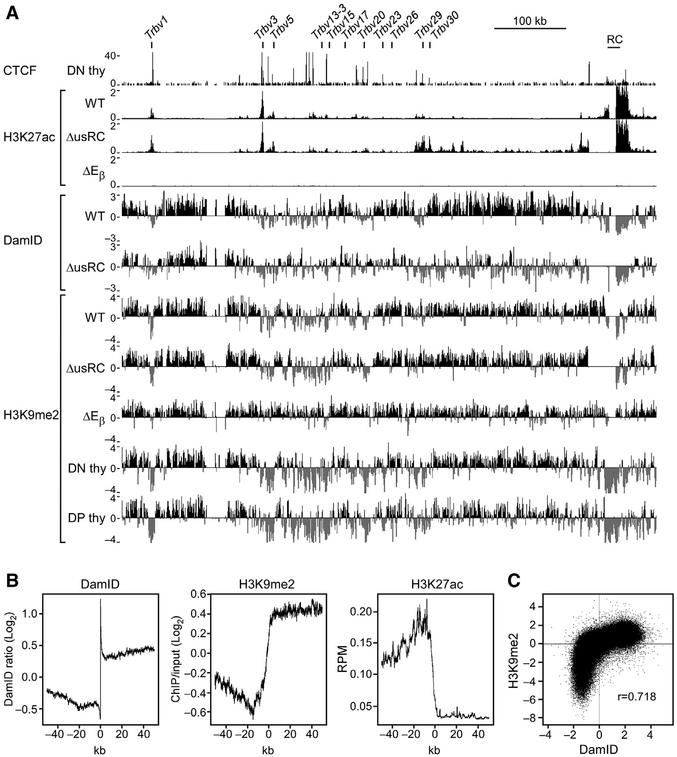
Figure 6. usRC Blocks the Spread of H3K27ac from the RC.
(A) ChIP-seq and DamID-seq profiles of the Tcrb locus. CTCF ChIP-seq data are from GEO: GSE41743 (Shih et al., 2012). DamID-seq data are identical to Figure 1C. CTCF and H3K27ac ChIP-seq values are expressed as reads per million. H3K9me2 ChIP-seq values are expressed as the log2 ratio of bound H3K9me2 over input. Reads were merged from two independent replicates.
(B) Feature profiles of LAD borders. LAD borders were identified genome-wide, and average signals across LAD borders were graphed across 100 kb centered on the LAD border. Non-LADs are oriented on the left, and LADs are oriented on the right.
(C) Correlation between H3K9me2 ChIP-seq and DamID-seq in wild-type VL3-3M2. Reads were placed into 10-kb bins. Pearson correlation coefficient is indicated.
See also Figures S3 and S4.

