
Figure 3.
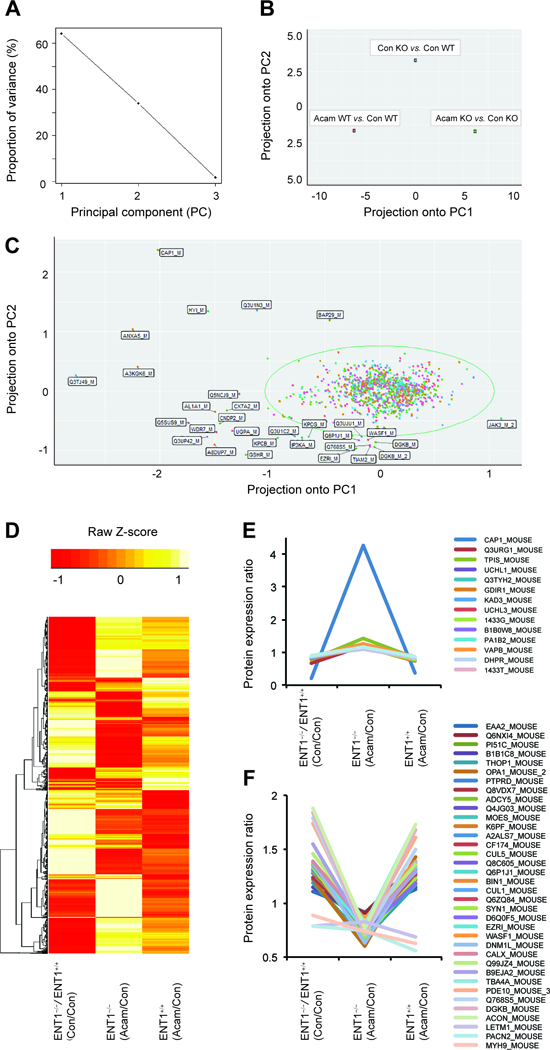
PCA analysis of protein expression in response to acamprosate treatment and deletion of ENT1. A. Ratio proportion of variance line graph identifies the 60% of proportion of variance of the first principal components. B. Acamprosate treatment in ENT1−/− mice shows significant projection in the first principal component (PC1) in ratio scatterplot. C. Ratio scatterplot for the total 1040 proteins. Labeled proteins indicate outliers having more than 3 standard deviations away from the mean. D. Heat map for altered protein expression in response to acamprosate treatment and deletion of ENT1 gene. Values were normalized by Z-Score E. Significantly increased protein expression by acamprosate treatment in ENT1−/− mice. F. Significantly decreased protein expression by acamprosate treatment in ENT1−/− mice.