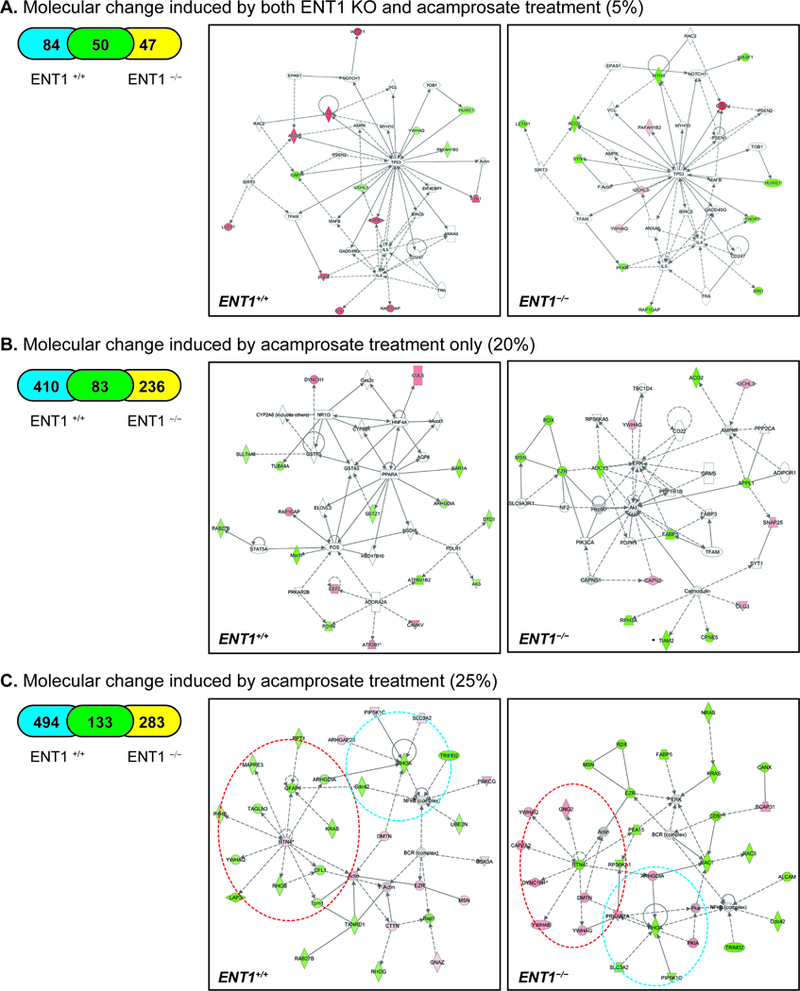
Figure 5.

Summary of IPA pathway analysis and representative network in the NAc of ENT1–/– mice. A. Significantly changed network by both genotype and acamprosate treatment B. Significantly changed network by acamprosate treatment only. C. Significantly changed network by acamprosate treatment with genotype. Blue circle represents RhoA cluster, while red circle indicates RTN4 network. Orange color indicates up-regulated protein, while green color indicates down-regulated proteins with statistical significance. Grey indicates protein was detected but did not show statistical significance. A color gradient indicates an identified protein complex consisting of significantly altered proteins and proteins that did not show statistical significance. (*p < 0.05 by t-test for mean protein expression change measured by label-free proteomics). Table 1. 50 accumbal proteins altered by both ENT1 genotype and acamprosate treatment.
