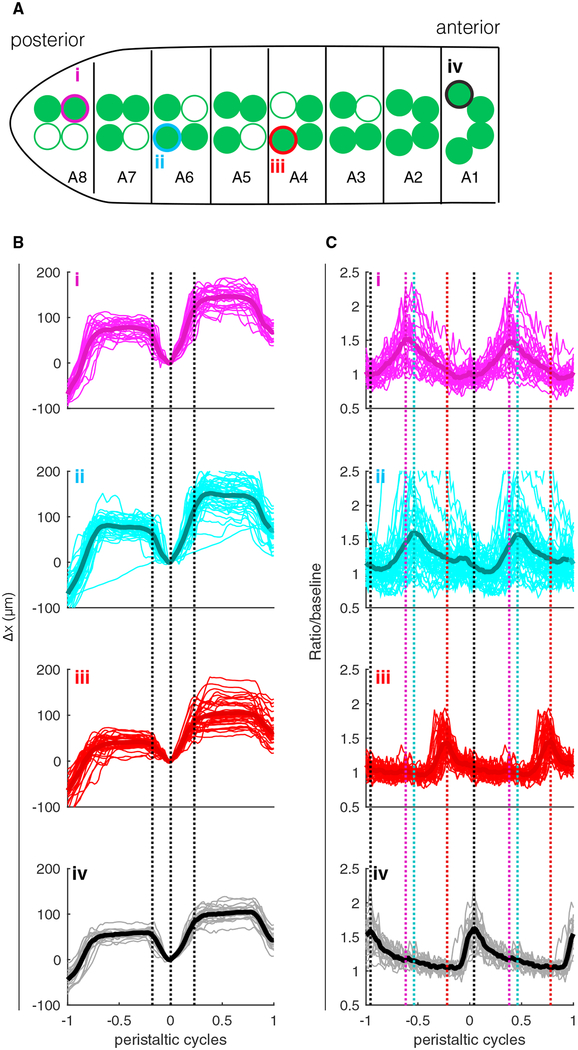
Figure 3. Serial Measurements of Motor Neuron Activity throughout the VNC of Single Larva.
(A) Sketch showing the locations in the VNC of motor neurons chosen for tracking; color and roman numerals match the labels in (B) and (C). A8–A1 label segments based on observed positions of cell bodies. Open circles indicate cell bodies were not visible in epifluorescence image.
(B and C) Position of the neuron along the direction of travel (B) and ratiometric activity measure (C) aligned to peristaltic cycle. On the horizontal axis, 0 represents the time at which the brain was furthest back in a given cycle, and −1 and +1 represent the times at which the brain was furthest back in the previous cycle and next cycle, respectively. The typical peristaltic period was 6–10 s. Light lines represent individual traces, and thick lines represent the mean. In (B), black dashed lines show the points of maximal average acceleration for all traces together and are meant to highlight the stereotypy of the aligned motion pattern between traces. In (C), the colored dashed lines show the points of maximum activity for the corresponding traces and are meant to aid comparison of the peak locations between traces. From top to bottom, n = 26, 43, 35, and 20 peristaltic cycles.
See also Figures S2 and S3.

