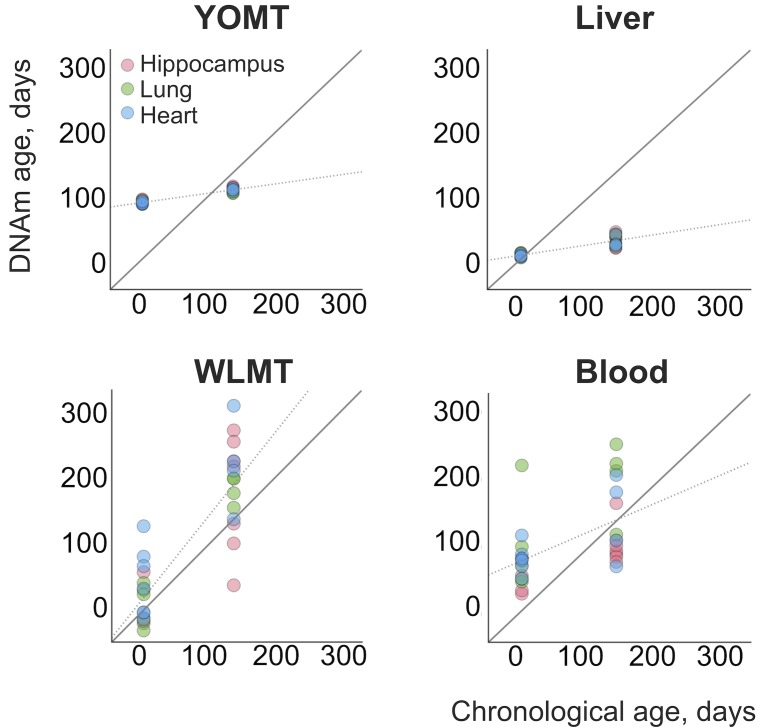
Figure 4. DNAm ages estimated for an independent dataset.
An additional dataset (Reizel et al., 2018) was tested with the four clocks. Solid line represents a perfect correspondence between DNAm age and chronological age. Dashed lines show slopes of linear regressions made for each DNAm clock based on the age values estimated with it. Slopes: 0.14 (YOMT), 0.16 (liver), 1.24 (WLMT), 0.45 (blood). p-values: (YOMT), (liver), (WLMT), (blood).

