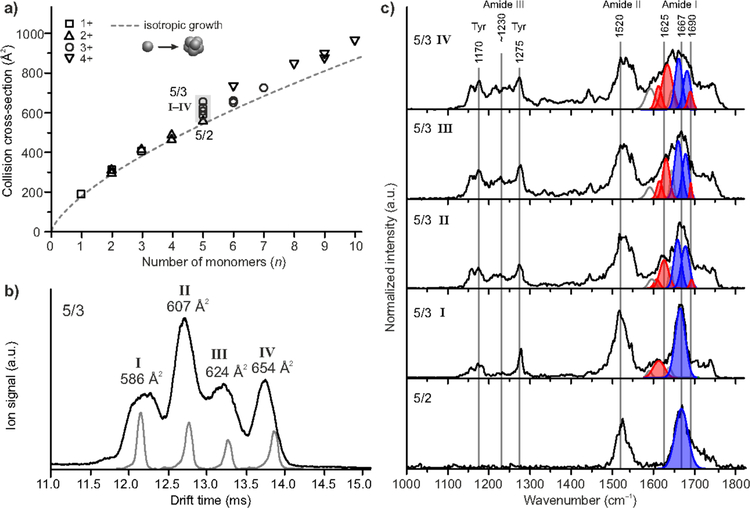
Figure 8. Ion mobility spectrometry and conformer-selected IR spectroscopy of YVEALL oligomers.
(a) Collision cross sections of YVEALL oligomers as a function of the number of monomers n. The dashed line denotes isotropic growth. The statistical error of the measured cross sections is less than 1% and smaller than the symbol size. (b) The ATD of the triply protonated pentamer (5/3) for which multiple conformers with distinct cross sections are observed. The narrow peaks depicted in gray correspond to the portions of the oligomer distribution that were selected for IRMPD-spectroscopic analysis. (c) IRMPD spectra of the doubly-protonated pentamer (5/2) and the drift-time selected species (I–IV) of the triply protonated YVEALL pentamers (5/3). The amide I region (1600–1700 cm−1) was fitted by multiple Gaussian peaks. The blue and red Gaussians represent IR bands corresponding to turn-like (1660–1685 cm−1) and β-sheet structures (1610–1640 cm–1 and ~1690 cm−1), respectively. For details about the fitting procedure see reference (83) from which the figure was reconstructed.

