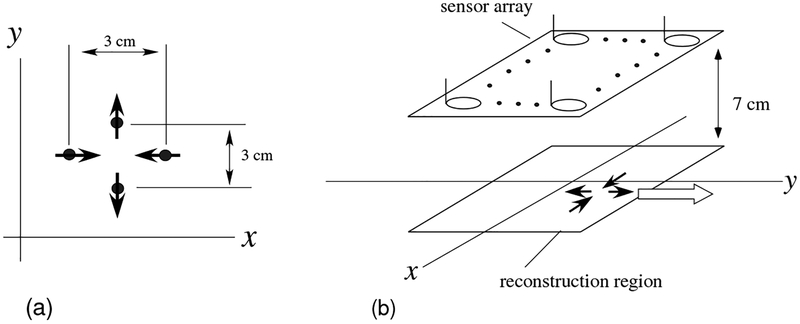
Figure 1:
(a) The source model used in the computer simulation. The model consists of four sources in which each pair of sources is 3 cm apart. (b) Schematic drawing of the source-sensor geometry used in the computer simulation. The four sources, depicted by the four solid arrows, travel along the y axis with a speed of 60 cm/s in the direction indicated by the white arrow. The source space is a two-dimensional plane (−8 ≤ x ≤ 8 cm, −6 ≤ y ≤ 6 cm), which is located 7 cm below the sensor array.

