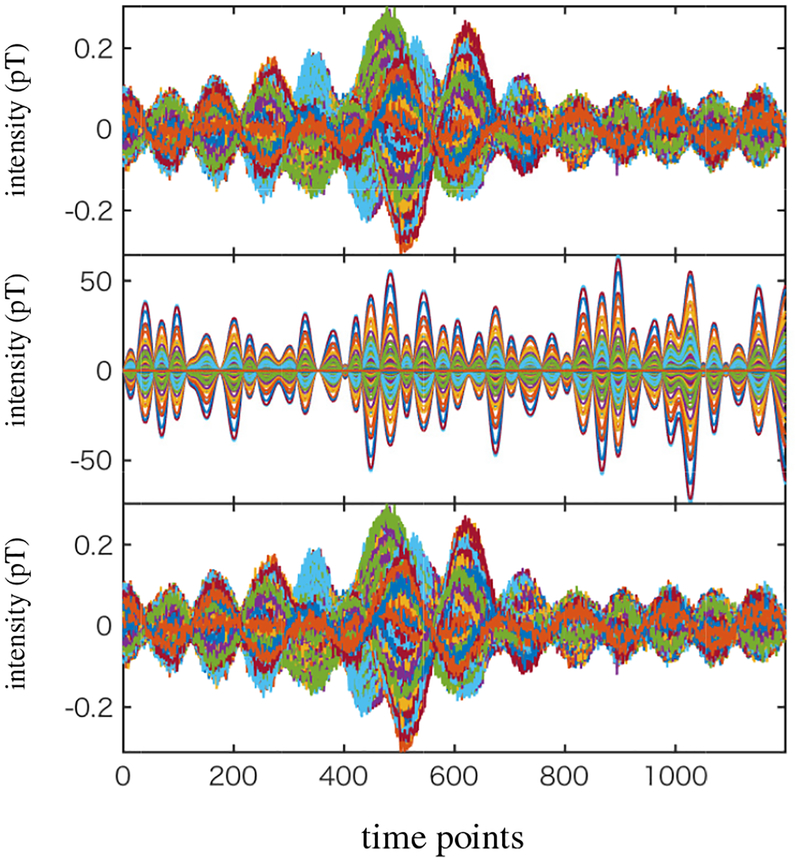
Figure 7:
The sensor data corresponding to the signal magnetic field plus sensor noise (top). The interference-added sensor data (middle). The interference-to-signal ratio was set equal to 100 in which the ISR is defined by the ratio ǁBIǁ/ǁBSǁ. (The time courses of the sensor data in this panel is dominated by the interference-source time course, due to the large ISR.) The interference-removed sensor time courses (bottom).

