
Figure 5. PFOS, PFOA, and PFNA impact PLZF area and intensity in spermatogonia derived under in vitro spermatogenic conditions.
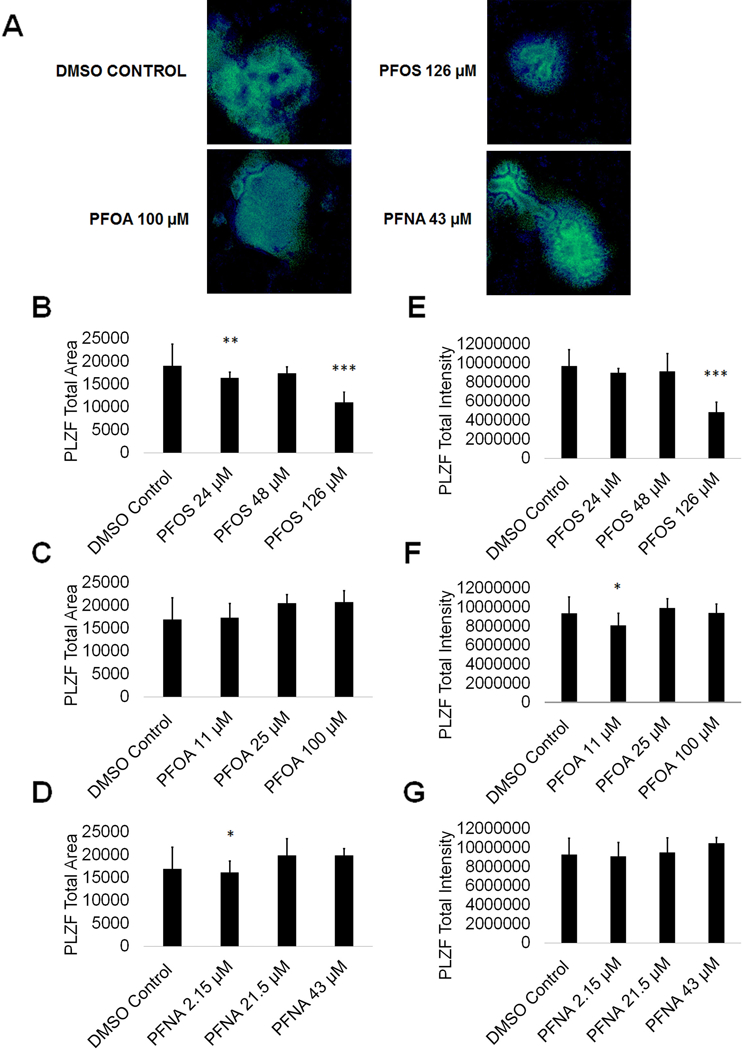
(A) Representative 5X images obtained by the Cellomics ArrayScan VT1 of PLZF + (green) and DAPI (blue)-stained colonies treated with the highest concentrations of PFOS, PFOA, and PFNA plus a negative control. All images are taken under the same imaging conditions and parameters. (B-D) Graphical representation showing that PFOS and PFNA reduce average total PLZF+ area in spermatogonia derived under in vitro spermatogenic conditions. (E-G) Graphical representation showing that PFOS and PFOA reduce average total PLZF+ intensity in spermatogonia. Three (n = 3) replications were performed for each condition. Significant changes in PLZF+ area and intensity were determined using a 1-way analysis of variance (1-way ANOVA) and validated via a Student’s t-test, where * is p<0.05, ** is p<0.01, and *** is p<0.001.