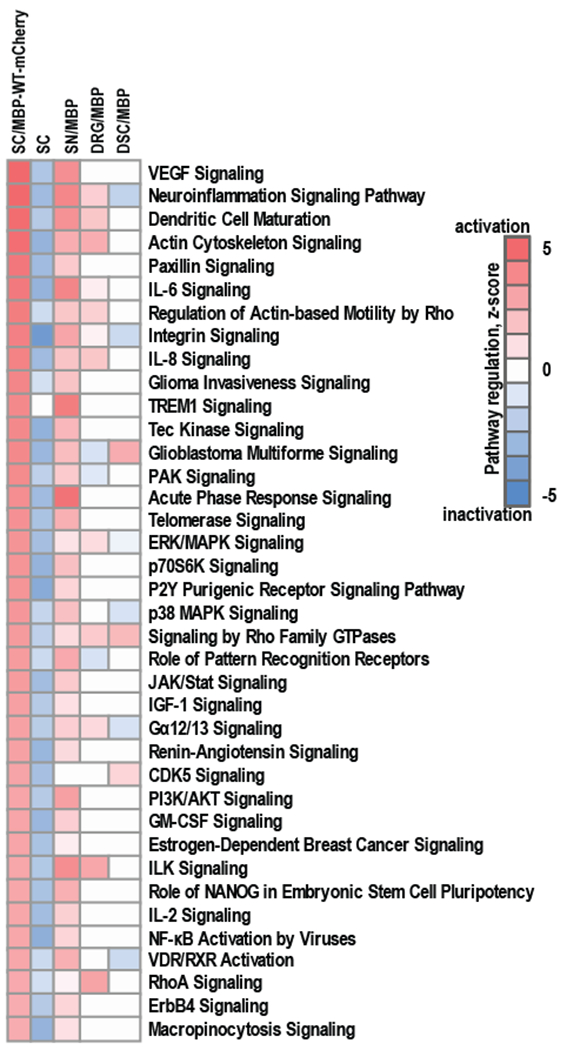
Fig. 3. Regulation of signaling pathways in Schwann cells in response to the expression of MBP-WT-mCherry.

RNA-seq was conducted on RNAs from Schwann cells expressing MBP-WT-mCherry (SC/MBP-WT-mCherry). Naive Schwann cells were used as a control (SC). Whole transcriptome sequencing was conducted using NextSeq 500 instrument (Illumina). RNA-seq read data were mapped to R. norvegicus genome (version Rn5) and normalized using Cufflinks software. RNA-seq data (Log2(FPKM) ≥ 0.01) were analyzed using Ingenuity IPA knowledgebase (Qiagen, version 2017) to predict the regulation of signaling pathways. RNA-seq data were compared to gene expression data from our previously published study [7, 8] in which MBP84-104 peptide was intrasciatically injected in female rats and following 7 days specimen of ipsilateral sciatic nerves (SN/MBP), dorsal root ganglia (DRG/MBP) and dorsal spinal cord (DSC/MBP) were collected, pooled (n=6/animal group) and total RNAs were profiled using gene expression microarrays (GEO ID GSE34868). Color scales represent predictive activation (red) or inactivation (blue) of signaling pathways based on their z-scores.
