Fig. 4.
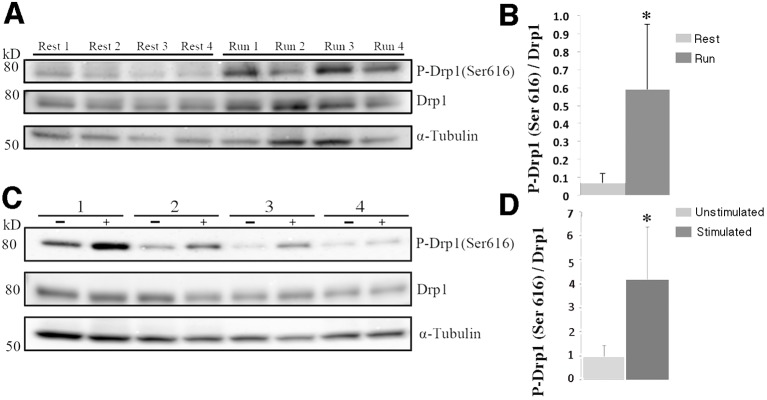
Increased p-Drp1 (Ser 616) levels in mitochondria of exercised and electrically stimulated muscles. (A,C) Immunoblot analysis of p-Drp1 (Ser 616) and total Drp1 in EDL from mice at rest and after running (n=4 mice each) (A), and TA from mice in the unstimulated and electrically stimulated groups (n=4 mice each) (C). In C, 1–4 indicates the number of mice used. (B,D) Mean±s.d. pixel density ratio of p-Drp1 (Ser 616) to total Drp1 (normalized to α tubulin) is 8-fold higher in EDL from mice after exercise compared to the muscles from resting mice (0.60±0.36 vs 0.071±0.05) (B), and 4.3-fold higher in electrically stimulated TA than in unstimulated TA (4.18±4.35 vs 0.98±0.93, paired t-test, *P<0.05) (D). The densitometric ratio of p-Drp1 (Ser 616) to α tubulin is also higher in run versus control (mean±s.d., 0.005±0.003 vs 0.0008±0.0008, P<0.05) and in stimulated versus contralateral leg (1.31±1.77 vs 0.42±0.30, P=0.09, paired t-test) (data not shown).

