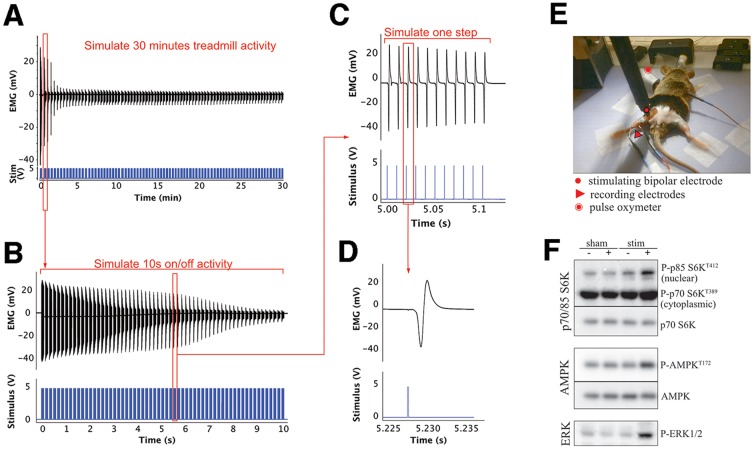
Fig. 6.
Sciatic nerve high-intensity stimulation protocol. (A,B) Electromyographic (EMG) and stimulus traces over 30 min of intermittent (10 s on/10 s off) sciatic stimulation that mimics the frequently interrupted running activity of mice (see Materials and Methods). (A) Each stimulus trace (in blue) represents a burst of 10 s (shown in detail in B). The EMG amplitude, relating the muscle response, shows an ∼80% decrease in amplitude within the first 5 min and a small decline after that. (B) A detail of a single burst of 5 V stimuli at 100 Hz repeated at 6 bursts/s, showing the response decline within one of the initial bursts. (C) Enlarged representation of a few of the evoked muscle action potentials repeated at 100 Hz for 100 ms in each burst. (D) Single muscle action potential evoked on stimulation of the sciatic nerve with a 5 V stimulus. (E) Stimulating and recording electrode placement. (F) Immunoblotting analysis revels that stimulation of muscles induces increased phosphorylation of known exercise-sensitive proteins such as p70/85S6K, AMPK and ERK.

