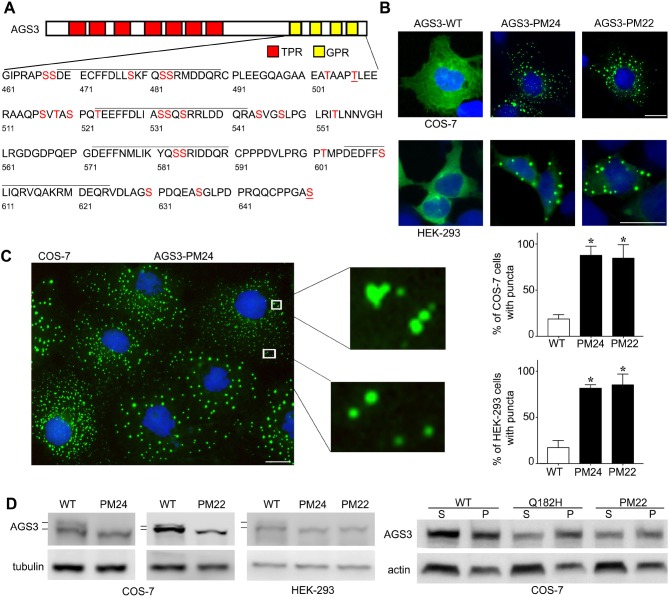
Fig. 1.
Subcellular distribution and biochemical analysis of candidate phosphorylation sites in the G-protein regulatory domain of AGS3. (A) Schematic representation of AGS3 domain organization with sequence information for the GPR domain. The lines over the sequence indicate the four GPR motifs in the protein. The serine (S) and threonine (T) residues indicated in red were substituted with alanine in AGS3-phosphomutant (AGS3-PM) proteins. (B,C) Subcellular distribution of WT AGS3, AGS3-PM24 and AGS3-PM22 in COS-7 and HEK-293 cells. The images are representative of five separate experiments and are shown at a magnification of 40×. Scale bars: 10 µm. Graphs in C show the percentage (mean±s.e.m.) of COS-7 and HEK-293 cells exhibiting cellular puncta. 200 cells were counted for each independent transfection (n=5). *P<0.05 by one-way ANOVA followed by Tukey's multiple comparison test. (D) Left: Immunoblotting of cell lysates from COS-7 and HEK-293 cells expressing WT AGS3, AGS3-PM24 or AGS3-PM22. Right: Immunoblotting of fractionated cell lysates from COS-7 cells expressing WT AGS3, AGS3-Q182H or AGS3-PM22, showing results from supernatant (S) and pellet (P) fraction samples. The images shown are representative of one (right panel) to five (left panel) separate experiments.

