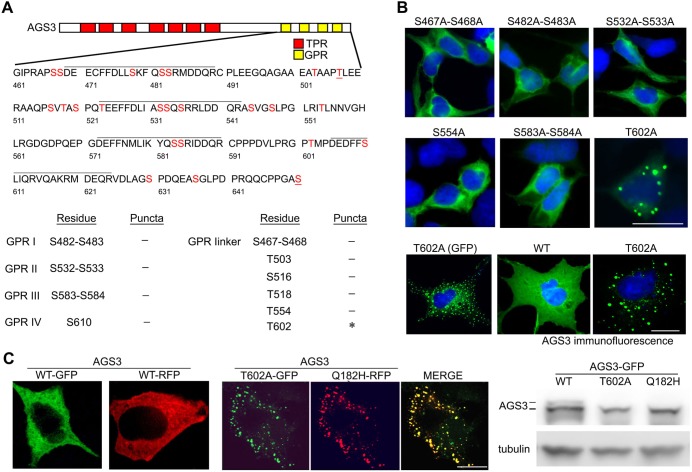
Fig. 2.
Determination of specific candidate serine/threonine phosphorylation site(s) in the subcellular distribution of AGS3. (A) Schematic representation of AGS3 domain organization. Serine (S) and threonine (T) residues indicated in the lower portion of the schematic were substituted with alanine. (B) Subcellular distribution of AGS3 in HEK-293 cells (upper and middle panel) or COS-7 cells (bottom panel) transfected with pEGFP::AGS3 constructs (250 ng). (C) Subcellular distribution and gel migration pattern of WT AGS3, AGS3-T602A and AGS3-Q182H in HeLa cells. Left panel, cells were transfected with WT pEGFP::AGS3 or WT pRFP::AGS3. Middle panel, cells were co-transfected with pEGFP::AGS3-T602A and pRFP::AGS3-Q182H constructs as indicated. Right, immunoblots of cell lysates from HeLa cells expressing WT AGS3, AGS3-T602A or AGS3-Q182H. Images in B,C are representative of three independent experiments, at 40× magnification. Scale bars: 10 µm.

