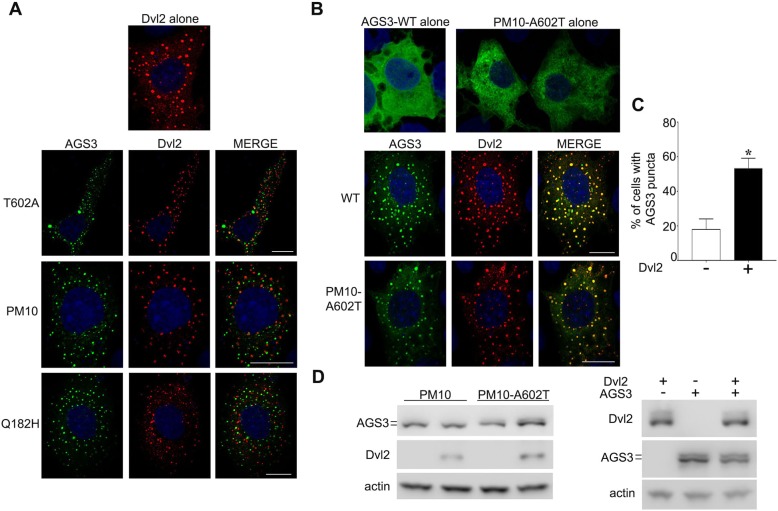
Fig. 3.
Analysis of AGS3 distribution upon co-expression with DVL2. (A,B) Subcellular distribution of AGS3 in COS-7 cells transfected with pEGFP::AGS3-WT (250 ng), pEGFP::AGS3-Q182H (250 ng), pEGFP::AGS3-T602A (250 ng), pEGFP::AGS3-PM10 (250 ng) and pEGFP::AGS3-PM10-A602 T (250 ng) and/or pRc/CMV2 Dvl-2-Myc (1000 ng). (C) Percentage (mean±s.e.m.) of COS-7 cells with WT AGS3 puncta in the absence of DVL2 co-expression, compared to cells with AGS3-T602A puncta on DVL2 co-expression. 200 cells were counted for each independent transfection. *P<0.05 by two-tailed Student's t-test. (D). Immunoblotting of COS-7 cell lysates of cells expressing WT AGS3 and AGS3-PM constructs with and without co-expression of DVL2. The images shown are representative of three independent experiments. Scale bars: 10 µm.

