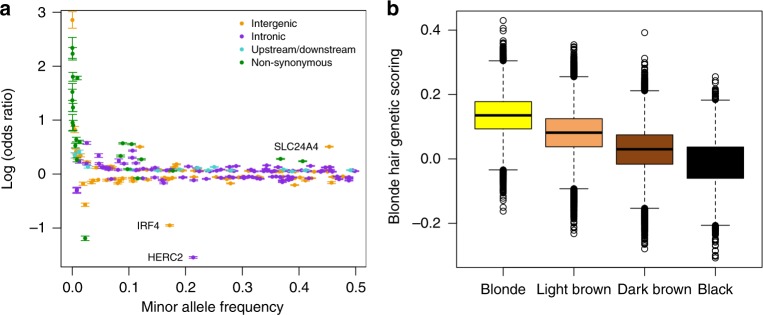
Fig. 4.
Odds ratio and minor allele frequency for blonde hair and polygenic phenotype scores. a Plot of minor allele frequency of blonde hair-associated variants vs. log of the odds ratio for blonde hair. Variants are colour-coded for annotation; intergenic (yellow), intronic (purple), 2 kb upstream or 500 bp downstream (cyan), non-synonymous coding (green). Error bars indicate 95% confidence intervals in OR, according to the logistic model calculated with blonde vs. brown and black hair colour (blonde = 39,397, non-blonde = 283,920). b Genetic scores derived from all lead variants from blonde vs. brown plus black hair colour, assuming an additive genetic model. The line in the boxplot indicates the median value and the error bars the 95% of the data (blonde: 39,397 individuals, light brown: 141,414 individuals, dark brown: 127,980 individuals and black: 14,526 individuals). Colours yellow, light brown, dark brown and black match the hair colour analysed

