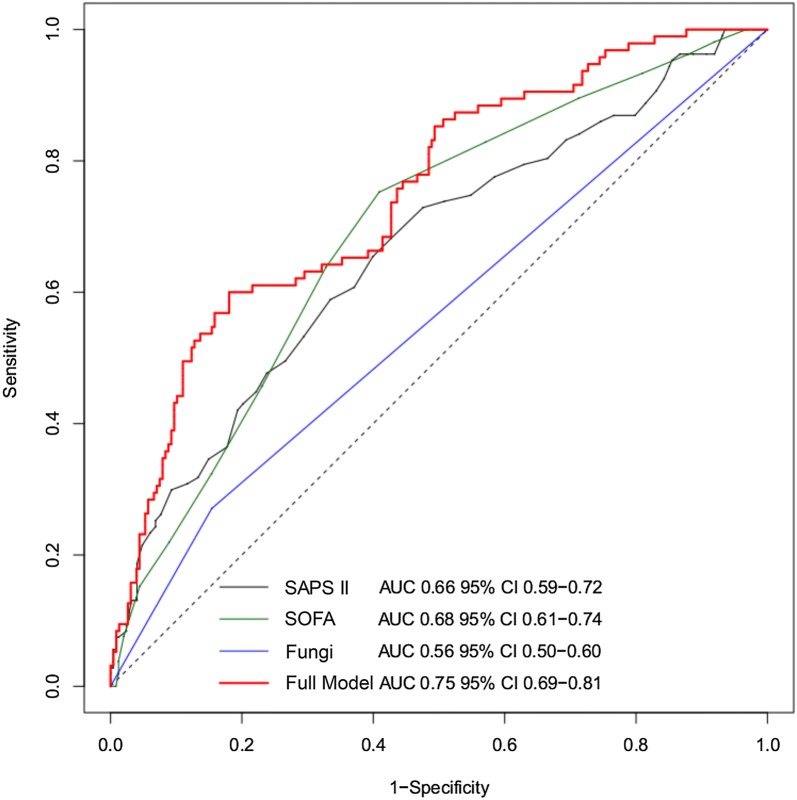
Fig. 3.
ROC curves comparing the predictive accuracy of the multivariable regression model (red curve) for all patients with each parameter used in the model: SAPS II (gray curve), SOFA D1 (green curve) and fungal infection (blue curve). SAPS II, Simplified Acute Physiology Score; SOFA, sequential organ failure assessment calculated the first day of administration of ivIgGAM

