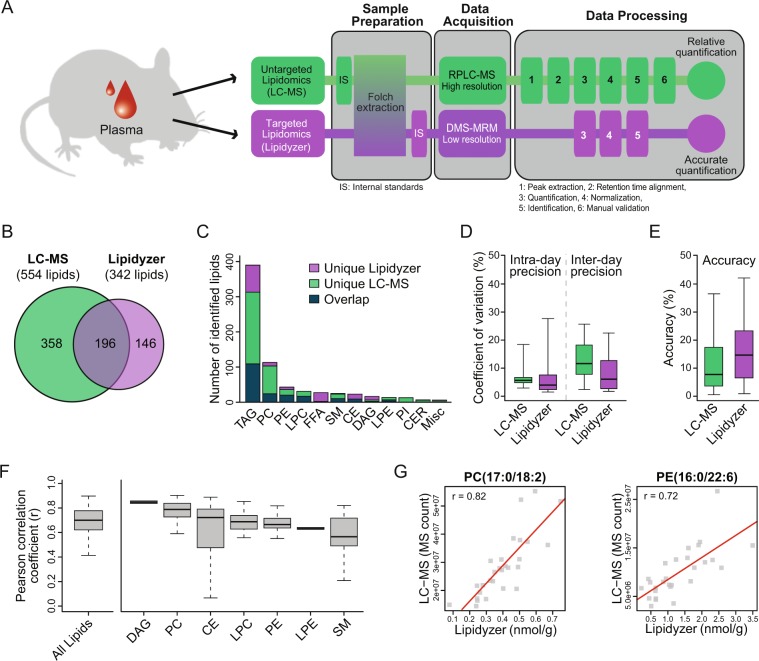
Figure 1.
Qualitative and quantitative cross-platform comparison. (A) Schematic illustration of the workflows for both untargeted LC-MS and targeted Lipidyzer platforms. Lipids were extracted from mouse plasma using a modified Folch method. Two internal standards (IS) were spiked-in prior to lipid extraction and were used for normalization in the LC-MS approach. The Lipidyzer platform requires the addition of a mixture of IS that is used for quantification, which in this case was added to the lipid extracts prior to analysis. Processing of LC-MS data consisted in six steps: (1) peak extraction, (2) retention time alignment, (3) quantification, (4) normalization, (5) identification, and (6) manual validation. In contrast, the Lipidyzer platform quantifies a pre-determined list of lipids, a process that is automated by the software provided with the platform. While our untargeted LC-MS provides relative lipid abundances, the Lipidyzer platform gives an accurate quantification in nmol/g (estimated concentration) based on the IS. DMS: Differential Mobility Spectrometry, MRM: Multiple Reaction Monitoring. (B) Venn diagram representing lipid coverage of each approach and their overlap. Note that the lipids detected with the LC-MS approach were converted to match the level of information provided by the Lipidyzer platform. Lipid coverage assessment was performed using data from three injections of a pool sample. (C) Barplot depicting the overlap in coverage by lipid class. (D) Boxplot representing intra- and inter-day precisions with the indicated platform. Precisions were calculated on IS spiked in a plasma matrix using five replicate injections on the same day (intra-day) and on three consecutive days (inter-day). Lipidomics Workflow Manager (LWM) recommended concentrations spanning 3 orders of magnitude were used to determine precisions. (E) Boxplot depicting accuracies of both platforms using IS at LWM recommended concentrations. Accuracy was calculated on each IS using a 7-point dilution series. (F) Pearson correlation coefficient of lipids identified by both platforms across all biological samples (87 lipids). TAG were excluded from the analysis because of nomenclature discrepancies between the two approaches. (G) Scatterplots showing examples of one PC and one PE with a Pearson correlation coefficient close to the median of the corresponding lipid class. TAG: triacylglycerol, DAG: diacylglycerol, PC: phosphatidylcholine, PE: phosphatidylethanolamine, PI: phosphatidylinositol, LPC: lysophosphatidylcholine, LPE: lysophoshatidylethanolamine, SM: sphingomyelin, CER: ceramide, CE: cholesterol ester, FFA: free fatty acid, MISC: miscellaneous.

