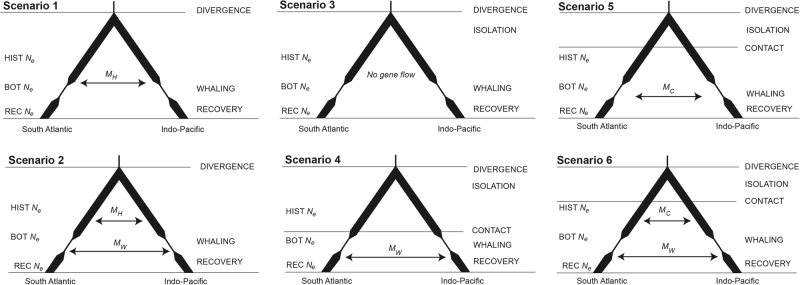
Fig. 2.
Scenarios compared using the approximate Bayesian computation framework. The six scenarios include continuous gene flow following population divergence with migration varying by scenario; Scenario 1: single migration rate MH; Scenario 2: two migration rates: one since divergence MH and one since the whaling era MW; or isolation following divergence, with either: Scenario 3: no subsequent gene flow; Scenario 4: gene flow at one migration rate since the whaling era MW; Scenario 5: one migration rate since secondary contact, MC; or Scenario 6: two migration rates: one since secondary contact, MC, and one since the whaling era, MW. In all scenarios, the populations diverge at time DIVERGENCE and maintain one HIST Ne until whaling, when each population declines to bottleneck population size BOT Ne during the whaling era and subsequently recover to REC Ne population size

