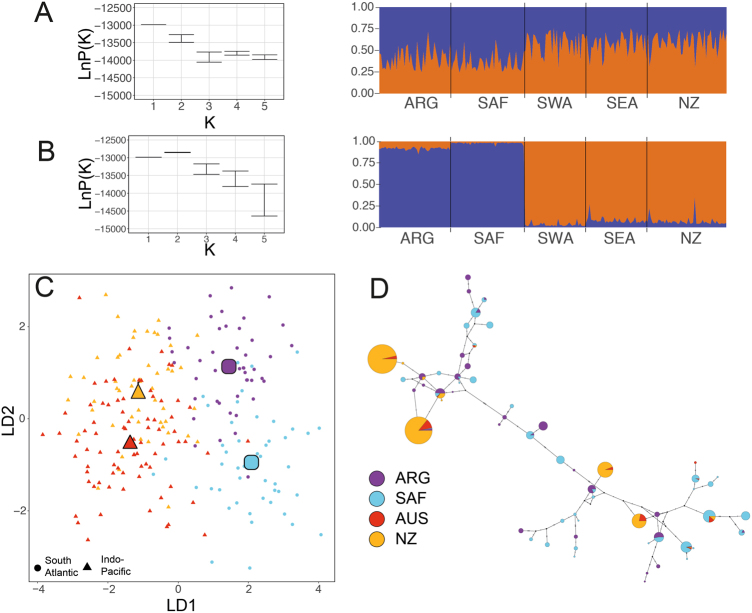
Fig. 3.
Inference of population structure of the southern right whale wintering habitats. Samples collected in Argentina (ARG) and South Africa (SAF) are pooled to form the South Atlantic dataset and samples from Australia (AUS) and New Zealand (NZ) are pooled to form the Indo-Pacific dataset. a, b STRUCUTRE results (left); mean log likelihood (LnP(K)), for K = 1–5, and (right) the proportion of each individual’s genome that is assigned to each cluster when K = 2 for a standard admixture setting and b location prior implemented. c Individuals plotted by linear discriminants (LD) from DAPC conducted with samples grouped by wintering ground. The large symbols show the centroid of each wintering ground. d Median joining haplotype network of mtDNA haplotypes. Haplotypes are coloured by wintering ground they were sampled in, using key shown. Inferred, unsampled haplotypes are shown by small black circles

