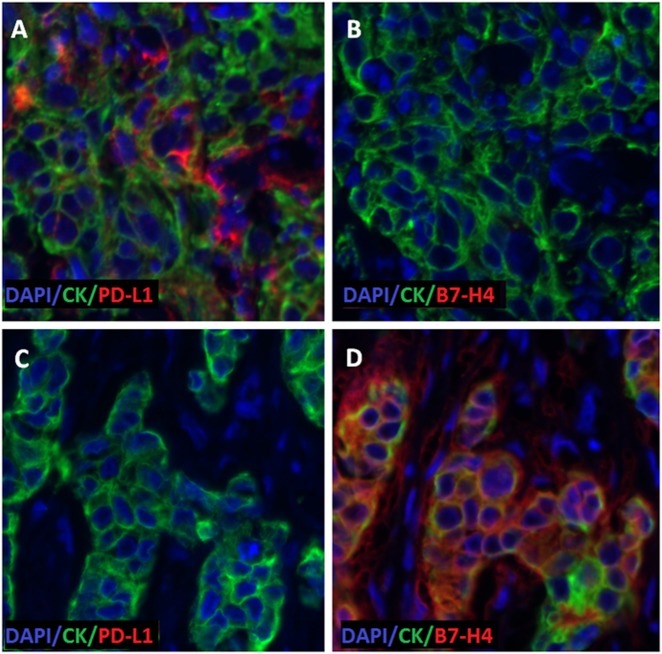
Fig. 2.
Representative fluorescence image illustrating inverse correlation of tumor PD-L1 and B7-H4 protein expression. Serial sections of two different cases (A, B = case 1; C, D = Case 2). Cytokeratin (green), DAPI (Blue). a, c: PD-L1 staining (red). b, d: B7-H4 staining (red), PD-L1 is high in tissue from case 1 in (a), and low in tissue from case 2 in (c). B7-H4 protein expression is low in tissue from case 1 in (b) and high in tissue from case 2 in (d)

