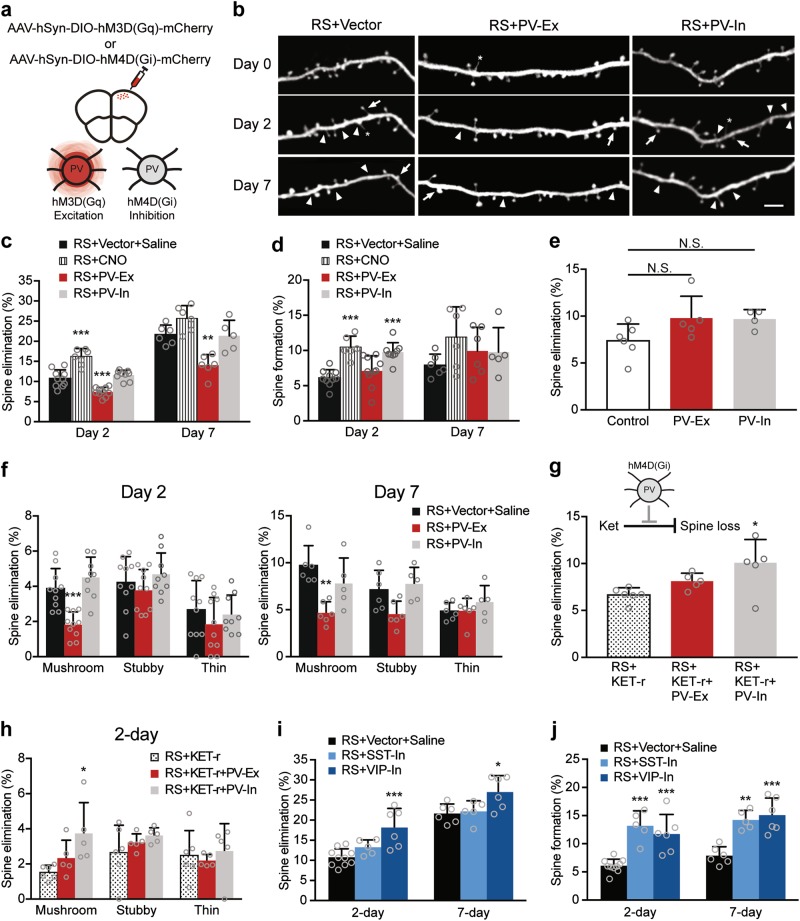
Fig. 5. Chemogenetic activation of parvalbumin (PV)-interneurons mimics ketamine’s effect on dendritic spine plasticity under stress.
a Schematic diagram showing the site of DREADD vectors injection. Upon CNO administration, hM3D(Gq) and hM4D(Gi) are activated to induce excitation and inhibition of PV interneurons, respectively. b Representative image of dendritic branches in the FrA of vector control, excitation of PV interneurons (PV-Ex) and inhibition of PV interneurons (PV-In) groups under RS. Arrowheads mark sites of spine elimination. Arrows mark sites of newly formed spines. Asterisks mark filopodia. Scale bar 4 µm. c Rate of dendritic spine elimination at day 2 and day 7 in RS + vector + saline, RS + CNO, RS + PV-Ex, and RS + PV-In groups. Day 2: P < 0.0001, F(3, 31) = 37.56, one-way ANOVA. Day 7: P < 0.0001, F(3, 19) = 15.38, one-way ANOVA. d) Rate of dendritic spine formation at day 2 and day 7 in RS + vector + saline, RS + CNO, RS + PV-Ex, and RS + PV-In groups. Day 2: P < 0.0001, F(3, 31) = 13.94, one-way ANOVA. Day 7: P = 0.2576, F(3, 19) = 1.458, one-way ANOVA. RS + Vector + saline (Day 2: n = 10, 1439 spines; day 7: n = 6, 768 spines), RS + CNO (n = 6, 946 spines for both day 2 and 7), RS + PV-Ex groups (Day 2: n = 10, 1384 spines; day 7: n = 6, 837 spines) and RS + PV-In (Day 2: n = 9, 1264 spines; day 7: n = 5, 743 spines). e) Rate of spine elimination at day 2 in non-stress control (n = 6, 929 spines), PV-Ex (n = 5, 615 spines) and PV-In (n = 4, 472 spines) groups. P = 0.0904, F(2,12) = 2.957, one-way ANOVA. f Percentage of eliminated spines classified as mushroom, stubby and thin spines after 2- and 7- day RS. Mushroom spines: Day 2, P < 0.0001, F(2,26) = 18.23, one-way ANOVA. Day 7, P = 0.0007, H = 10.9, Kruskal–Wallis test. g Rate of dendritic spine elimination at day 2 in RS + KET-r (n = 6, 892 spines), RS + KET-r + PV-Ex (n = 5, 777 spines) and RS + KET-r + PV-In (n = 5, 638 spines) groups. Elimination: P = 0.0178, F(2,13) = 5.579, one-way ANOVA. h Percentage of eliminated spines classified as mushroom, stubby, and thin spines after 2 days of RS in RS + KET-r, RS + KET-r + PV-Ex, and RS + KET-r + PV-In groups. Mushroom spines: P = 0.0236, F(2, 13) = 5.064, one-way ANOVA. * P < 0.05 compared with RS + KET-r. i Rate of dendritic spine elimination at day 2 and day 7 in RS + vector + saline, RS + SST-In, RS + VIP-In groups. Day 2: P = 0.0008, F(2, 18) = 11.02, one-way ANOVA. Day 7: P = 0.0207, F(2, 14) = 5.178, one-way ANOVA. j Rate of dendritic spine formation at day 2 and day 7 in RS + vector + saline, RS + SST-In, RS + VIP-In groups. Day 2: P < 0.0001, F(2, 18) = 18.91, one-way ANOVA. Day 7: P = 0.0001, F(2, 14) = 17.98, one-way ANOVA. RS + SST-In (Day 2: n = 5696 spines; day 7: n = 5, 676 spines), RS + VIP-In (Day 2: n = 6, 789 spines; day 7: n = 6, 744 spines). c, d, f, i, j *P < 0.05, **P < 0.01, ***P < 0.001 compared with RS + vector + saline. Data are presented in mean ± s.d

