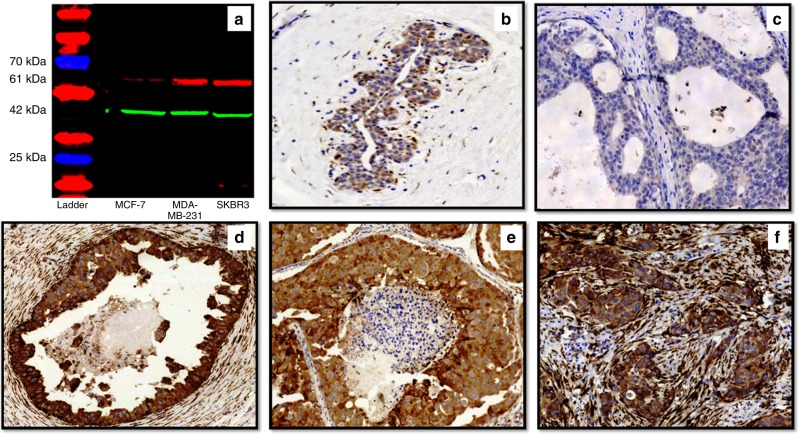
Fig. 1.
Anti-P4HA2 antibody validation and patterns of protein expression. a Western blot of mouse monoclonal anti-P4HA2 antibody showing a single specific band (upper red band) at expected molecular weight (61 kDa) in MCF-7, MDA-MB-231 and SKBR3 cell lysates. The lower green band represents the beta-actin (positive control) at 42 kDa molecular weight, b Normal breast duct (x20) shows faint cytoplasmic staining of P4HA2 in the normal epithelial cells. Occasional faint staining in the myoepithelial cells is also noticed. c Negative P4HA2 expression (x40) in a pure DCIS case; (d) strong expression of P4HA2 in tumour cells and surrounding fibroblasts (x20) in a pure DCIS case. e, f Expression of P4HA2 in a mixed case (x40) showing almost the same intensity within the tumour cells of DCIS component (e) and invasive component (f) while expression within the surrounding stromal fibroblasts is higher in invasive component (f)

