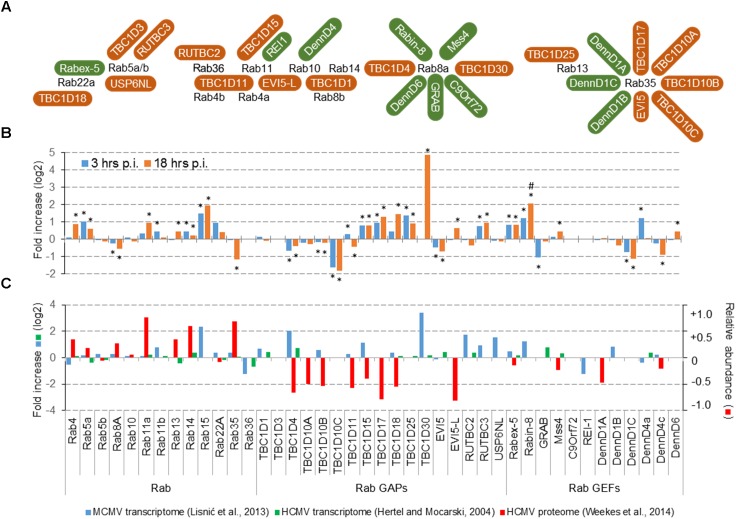
FIGURE 2.
Effect of CMV infection on the expression of Rab proteins that control endosomal recycling route and their known GEFs and GAPs. (A) Rab proteins that control endosomal recycling, their known GAPs (brown) and GEFs (green). The illustration outlines the known interaction reviewed recently by Müller and Goody (2018). (B) Transcriptome of dendritic cells DC2.4 at 3 and 18 h post infection (p.i.). The data is represented as the fold change (log2) of gene expression in wild-type MCMV infected cells relative to the mock-infected cells. Shown are the data for all differentially expressed genes. A significant difference to mock-infected cells at p-value smaller than 0.1 (∗) and 0.05 (#) is shown above or below bars. Both, mock and MCMV-infected cells were analyzed in three replicates. (C) Comparative analysis of the transcriptome data in MCMV- (Lisnic et al., 2013) and HCMV- (Hertel and Mocarski, 2004) infected cells, and proteome data in HCMV-infected cells (Weekes et al., 2014). The transcriptome data for MCMV represent pooled samples from all phases of infection, the transcriptome data for HCMV represent samples at the end of the E-phase of infection (50 h p.i.), and the proteome data for HCMV represent samples at 40 h p.i. Left axis relates to the transcriptome data (log2 fold change), and the right axis relates to the proteome data (the percentage of change relative to mock-infected cells).

