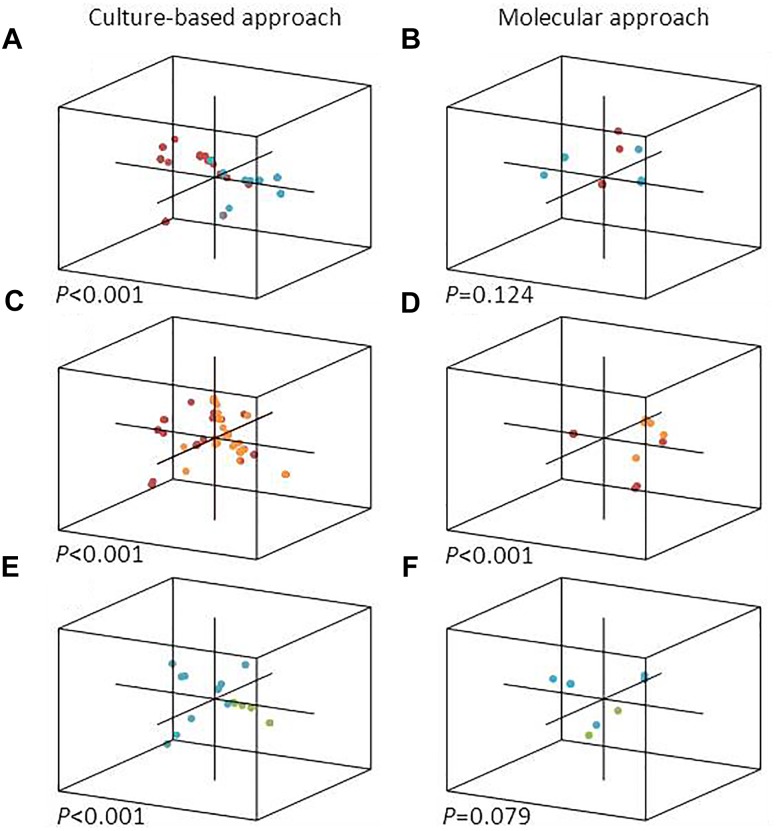
FIGURE 1.
PCoA representation of each single diatom cell analyzed in this study, with a 3D position depending on the composition of its epibiotic bacterial community. Culture-based (left) and molecular (right) bacterial diversity attached to diatoms isolated from collection cultures (A,B), natural samples (E,F) and both (C,D) are shown. Diatom cells correspond to T. delicatula RCC 2560 (red), C. danicus RCC 2565 (blue), environmental Thalassiosira spp. (orange), and environmental Chaetoceros spp. (green).

