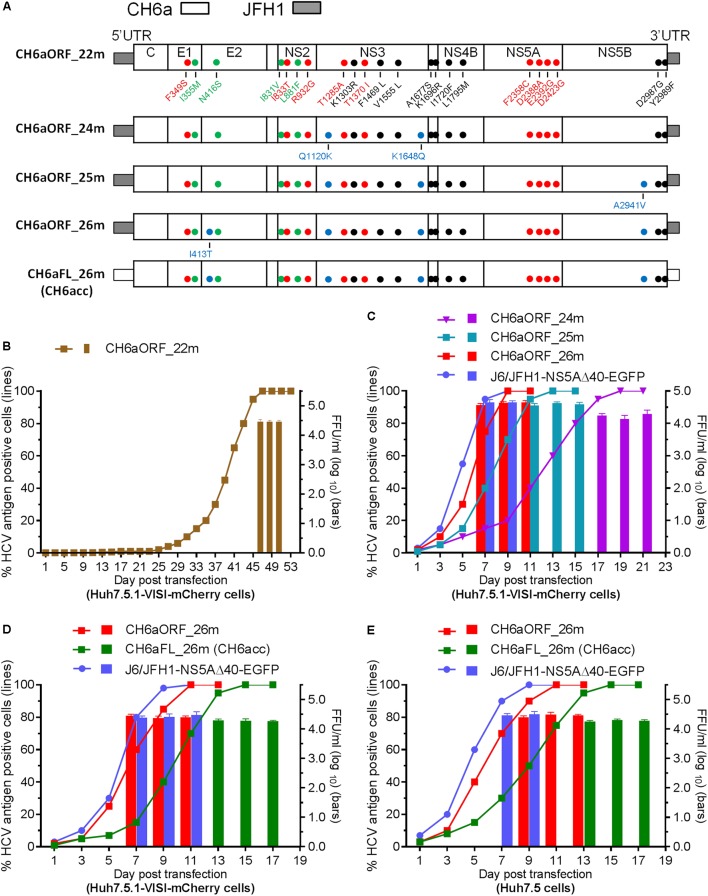
FIGURE 4.
CH6a ORF and full-length infectious clones replicated efficiently in transfection cultures. (A) Schematic diagrams of CH6a ORF and full-length recombinants (CH6aORF and CH6aFL) with 22, 24, 25, and 26 mutations (22m, 24m, 25m, and 26m). The 22m was the combination of 18m (Figure 3A) plus I833T/R932G (from C-5A_11m viruses) (Table 2) and D2987G/Y2989F (GF mutations) (Li et al., 2012a). Mutations Q1120K/K1648Q, Q1120K/K1648Q/A2941V, and I413T/Q1120K/K1648Q/A2941V identified from CH6aORF_22m (in B and Table 3) were engineered into the CH6aORF_22m to make CH6aORF_24m, CH6aORF_25m, and CH6aORF_26m, respectively. Mutations were indicated by colors [black, mutations identified previously; green, 4m from C-NS2 virus (Table 1); red, C-5A_11m virus (Table 2); and blue, CH6aORF_22m (Table 3)]. (B–D) Transfection of CH6a ORF and full-length recombinants with different mutations as indicated. The percentage of mCherry-positive cells was estimated (left y-axis; lines) and HCV infectivity titers at peak infections were determined (mean of triplicate infections ± SD, right y-axis; bars). The efficient J6/JFH1-NS5AΔ40-EGFP was used as positive control (Gottwein et al., 2011a). (E) Transfections of CH6aORF_26m and CH6aFL_26m (CH6acc) in Huh7.5 cells. The HCV-positive cells were visualized by anti-HCV Core immunostaining (left y-axis; lines), and HCV infectivity titers were done by FFU assay (mean of triplicate infections ± SD, right y-axis; bars).

