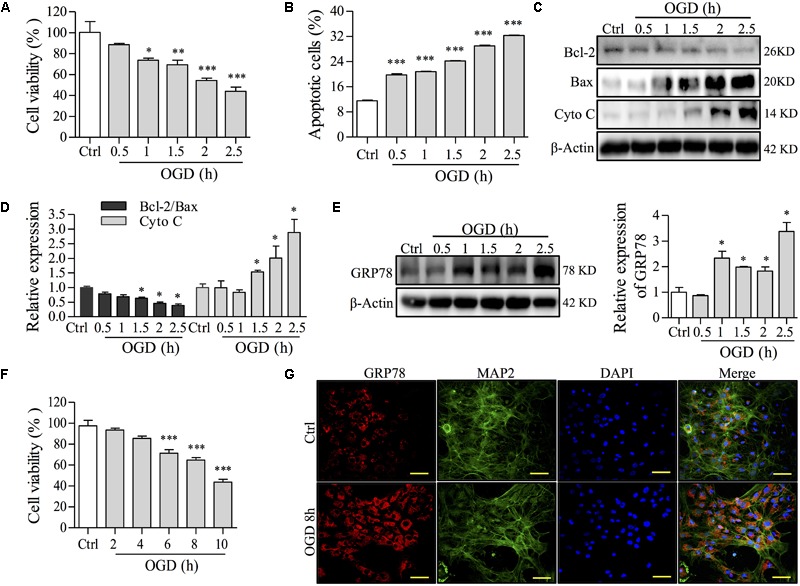
FIGURE 2.

The effects of OGD time on cell damage and ER stress in NGF-induced PC12 cells and primary culture neurons. (A) The effect of OGD-induced damage on cell viability was determined by an MTT assay in PC12 cells. (B) Apoptosis induced by OGD was determined with Annexin-V/PI staining followed by FCM analysis in PC12 cells. Percentages of apoptotic cells are shown. (C) After OGD incubation for the indicated time, the levels of Bcl-2, Bax, Cyto C and β-Actin in PC12 cells were analyzed by Western blot. β-Actin was a loading control. (D) Relative expressions of the Bcl-2/Bax ratio and Cyto C form (C) were analyzed and are shown. (E) GRP78, a central regulator for ER stress, after OGD incubation for different times, was observed by Western blot in PC12 cells. Relative GRP78 expression is shown on the right. (F) Primary neuron viability was assayed by an MTT assay after OGD incubation for 2, 4, 6, 8, or 10 h. (G) GRP78 expression by immunofluorescence staining after OGD for 8 h in primary neurons. MAP2 is a marker for neurons. Nuclei were stained with DAPI. Scale bar = 50 μm. Ctrl: control group; PC12 cells or primary culture neurons were incubated in normal medium under normoxia (37°C, 5% CO2) in each experiment. ∗P < 0.05, ∗∗P < 0.01, and ∗∗∗P < 0.001 vs. Ctrl group (n = 3).
