
FIGURE 3.
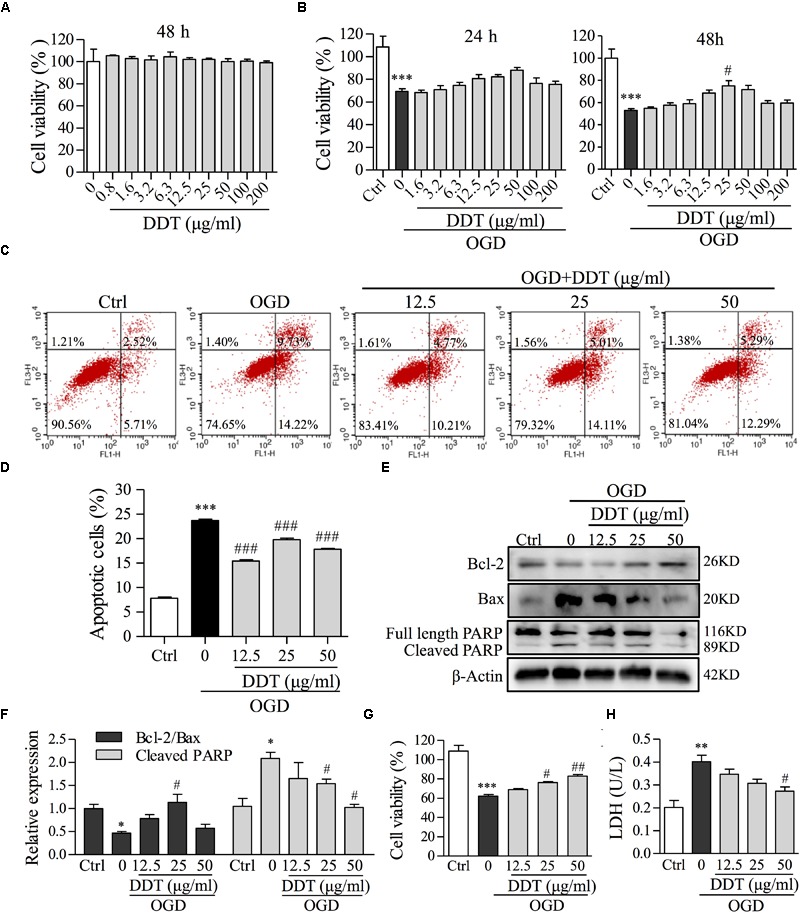
The effects of DDT pretreatment on OGD-induced cell viability and apoptosis in NGF-induced PC12 cells and primary culture neurons. (A) PC12 cells were treated with the indicated concentrations of DDT for 48 h. Cell viability was assessed using an MTT assay after treatment. (B) PC12 cells were treated with DDT for 24 h or 48 h, followed by OGD for 1.5 h and cell viability was assessed by an MTT assay. (C) PC12 cells pretreated with DDT at the concentrations of 12.5, 25, or 50 μg/ml for 48 h, followed by OGD for 1.5 h, were stained with Annexin V and PI, and then analyzed by flow cytometry (FCM). (D) Data are expressed as the average percentages of apoptotic cells from (C). (E) PC12 cells treated with DDT and incubated with OGD exposure were collected and lysed. The levels of Bcl-2, Bax, and PARP were analyzed by Western blot. β-Actin was the loading control. (F) The values represent the ratio of Bcl-2/Bax and the cleavage of PARP quantified by Image J from (E). (G) The viability of primary neurons treated with DDT for 48 h, followed by OGD for 8 h, was assessed by an MTT assay. (H) The effect of DDT for 48 h on the release of LDH in culture medium from primary neurons after 8 h incubation in OGD was determined using an LDH assay kit. ∗P < 0.05, ∗∗P < 0.01, and ∗∗∗P < 0.001 vs. Ctrl group; #P < 0.05, ##P < 0.01, and ###P < 0.001 vs. OGD group (n = 3).