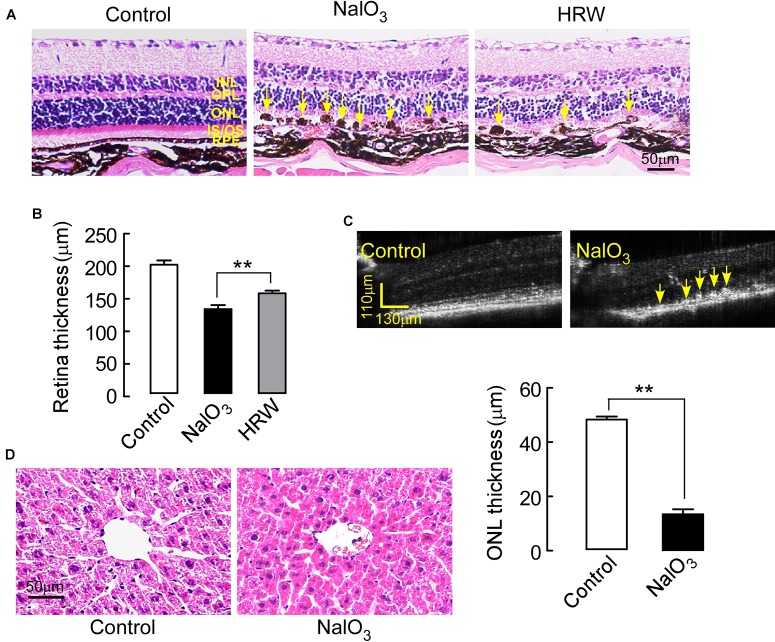
FIGURE 3.
Effects of HRW on NaIO3-induced retinal morphological impairment in mice. Mouse eyeballs were harvested after cotreatment with HRW and NaIO3 for 12 days. (A) Representative images of H&E-stained eyeball sections from control and NaIO3 mice treated with or without HRW. Yellow arrows indicate drusen-like melanin depositions in the RPE layer. (B) Quantitative analysis of retinal thickness via H&E-stained eyeball sections. The values are expressed as the mean ± SEM, n = 10. (C) Representative images of OCT in the mouse retina in control and NaIO3 groups. Yellow arrows point toward areas of hyperreflexia in the RPE. (D) H&E staining of the liver after 5 days of NaIO3 injection. n = 5, ∗∗P < 0.01 vs. the NaIO3 group.

