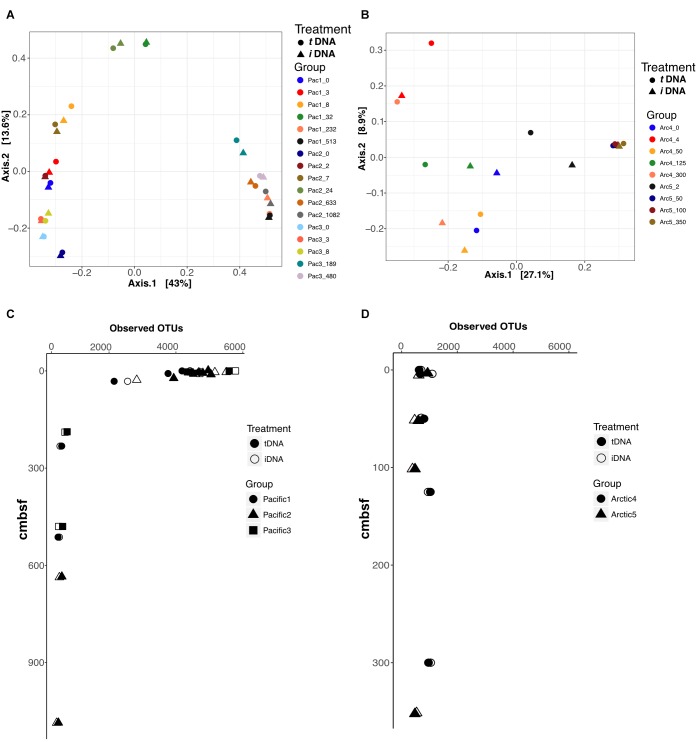
FIGURE 5.
Principal Coordinate Analyses (PCoA) using Bray-Curtis distances to compare effects of iDNA and tDNA pools on 2-dimensional ordination for all sample pairs in (A) Pacific and (B) Arctic. Observed OTUs for all sample pairs in Pacific (C) and Arctic (D) data. Filled and open symbols represent tDNA and iDNA datasets, respectively.

