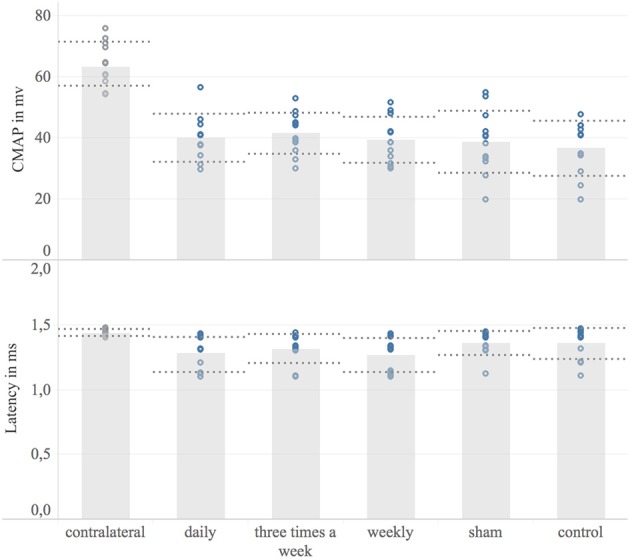
Figure 5.

Electrodiagnostic evaluation. Shown are bar graphs of the mean maximum compound muscle action potential (CMAP) in millivolt [mV] (Upper) and the distal latency in milliseconds [ms] (Lower) with standard deviation (dashed lines) combined with scatter plots of the measured data (dots). Underlying electrodiagnostic analyzes were conducted eight weeks post-surgery.
