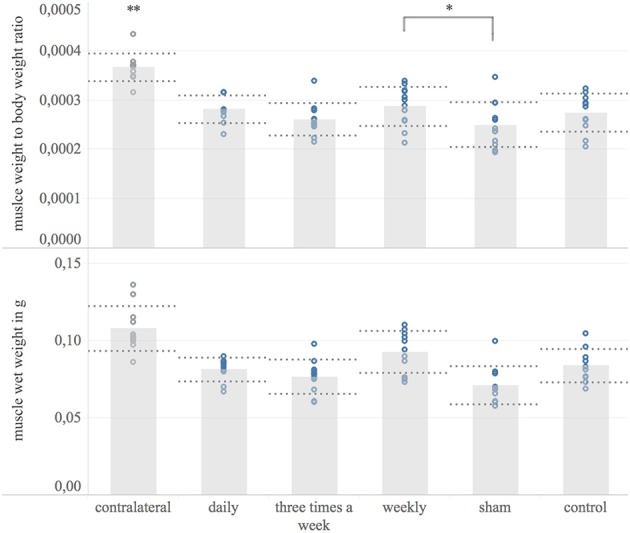
Figure 6.

Target muscle wet weight. Shown are bar graphs of the mean muscle wet weight to body weight ratio (Upper) and the mean wet weights of the ipsilateral flexor digitorum superficialis muscle in microgram [μg] (Lower) with standard deviation (dashed lines) combined with scatter plots of the measured data (dots) 8 weeks post-surgery. *The weekly treated group showed significantly higher muscle weight to body weight ratio compared to the sham-group. **The contralateral muscle weight normalized to body weight was significantly higher compared to the operated side among all experimental groups.
