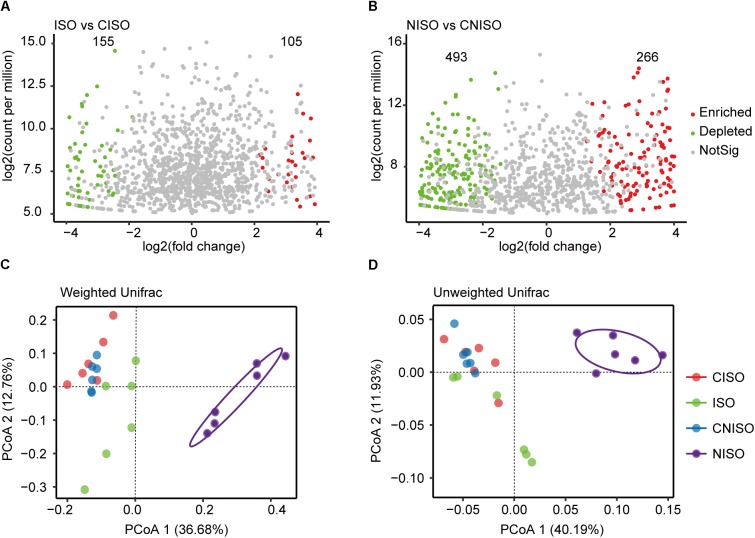
FIGURE 3.
Comparison of intestinal microbiota structure among four different groups after two diets intervention for 1 week. Volcano plot showed the enriched and depleted OTUs. (A) Compared to CISO group, the changes was detected in ISO group. (B) Compared to CNISO group, the changes was detected in NISO group. (C,D) Plot of unconstrained principal coordinate analyses based on weighted and unweighted UniFrac distances. NotSig, not significant.

