
Figure 4.
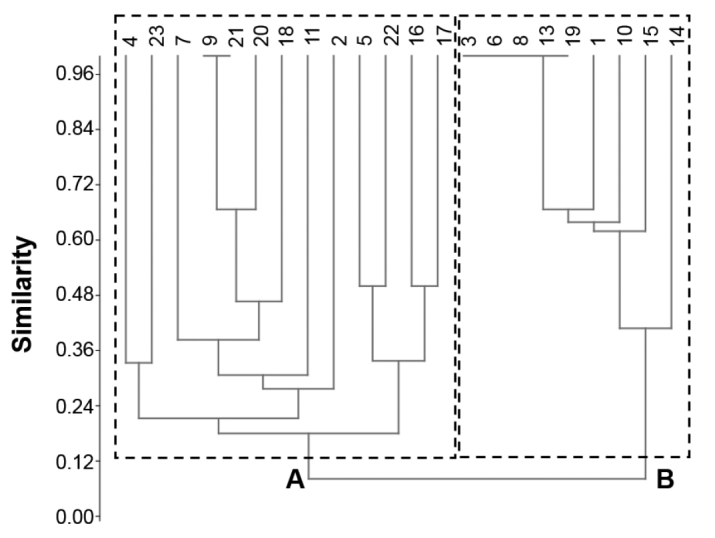
Hierarchical cluster analysis dendrogram showing two main groups (A and B) based on the species composition of isopod assemblages. Numbers on the top are the numbers (ID-s) of the sample sites (for IDs see Suppl. material 1).
Official websites use .gov
A
.gov website belongs to an official
government organization in the United States.
Secure .gov websites use HTTPS
A lock (
) or https:// means you've safely
connected to the .gov website. Share sensitive
information only on official, secure websites.
Hierarchical cluster analysis dendrogram showing two main groups (A and B) based on the species composition of isopod assemblages. Numbers on the top are the numbers (ID-s) of the sample sites (for IDs see Suppl. material 1).