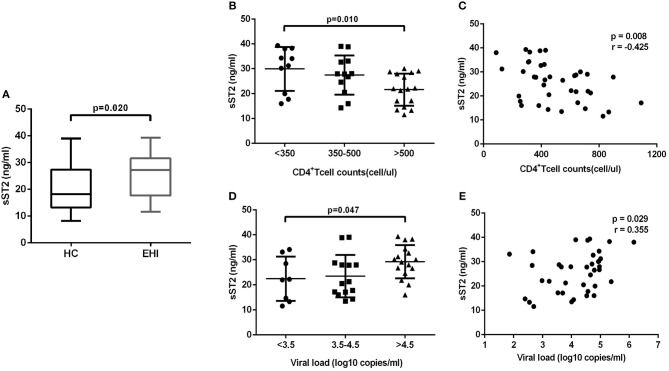
Figure 4.
EHI patients demonstrate high serum sST2 levels. (A) Comparison of the plasma sST2 level in EHIs (n = 38) and HCs (n = 20), by Mann-Whitney test. (B) Comparison of plasma sST2 in EHIs in CD4+ T cell count groups (<350; 350–500; >500 cells/μL); (D) Comparison of plasma IL-33 in EHIs in different viral load groups (<3.5; 3.5–4.5; >4.5 log copies/mL), by Mann-Whitney test. The relationship between plasma IL-33 and CD4+ T cell counts (C), viral load (E) in EHI patients; Spearman's rank correlation coefficients r and p-values are indicated in figures.

