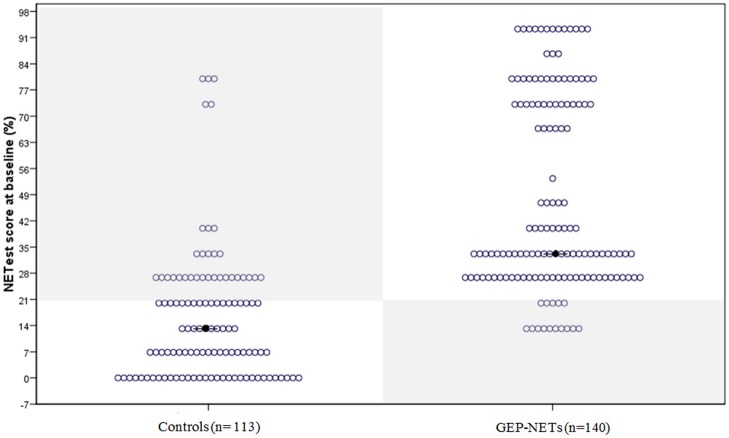
Figure 1.
The distribution of the NETest in healthy volunteers and patients with GEP-NETs. The distribution of the NETest results is illustrated in both controls (Left) and GEP-NET patients (Right). The results inside the gray squares illustrate deviant results when using the optimal cut-off for our population (20%). The black spots reflect the median NETest outcome. Median NETest outcome in NET patients was 33% compared to 13% in controls (p < 0.001).

