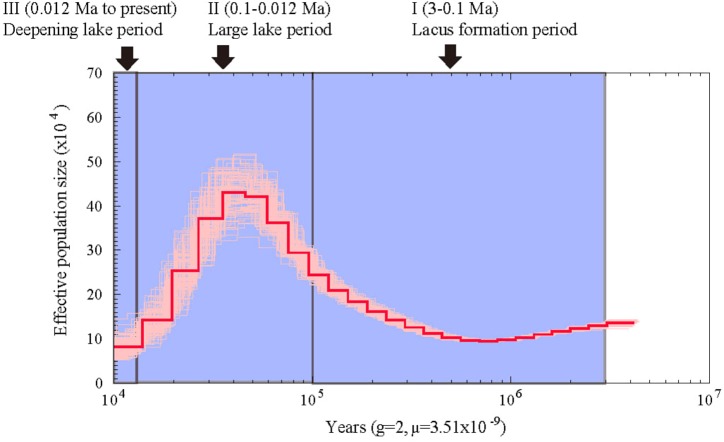
FIGURE 3.
Estimated population demography of A. grahami using the PSMC model. The bold red line represents the estimated effective population size changes of A. grahami, and the thin pink lines represent 100 bootstrap estimations. The demarcated blue blocks denote three main periods during the development of Fuxian Lake, including (I) lacus formation period (3–0.1 Ma), (II) large lake period (0.1–0.012 Ma), and (III) deepening lake period (0.012 Ma to present).

