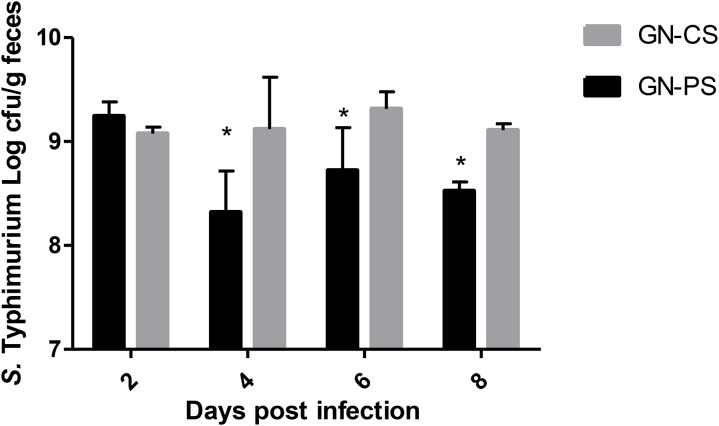
FIGURE 2.
Salmonella Typhimurium fecal population levels in gnotobiotic mice monoassociated with L. diolivorans 1Z (GN-PS) or not (GN-CS) 2, 4, 6, and 8 days after oral challenge with the pathogen. The symbol “∗” indicates statistical difference between groups at each time of infection (ANOVA followed by Tukey test; P < 0.05).

