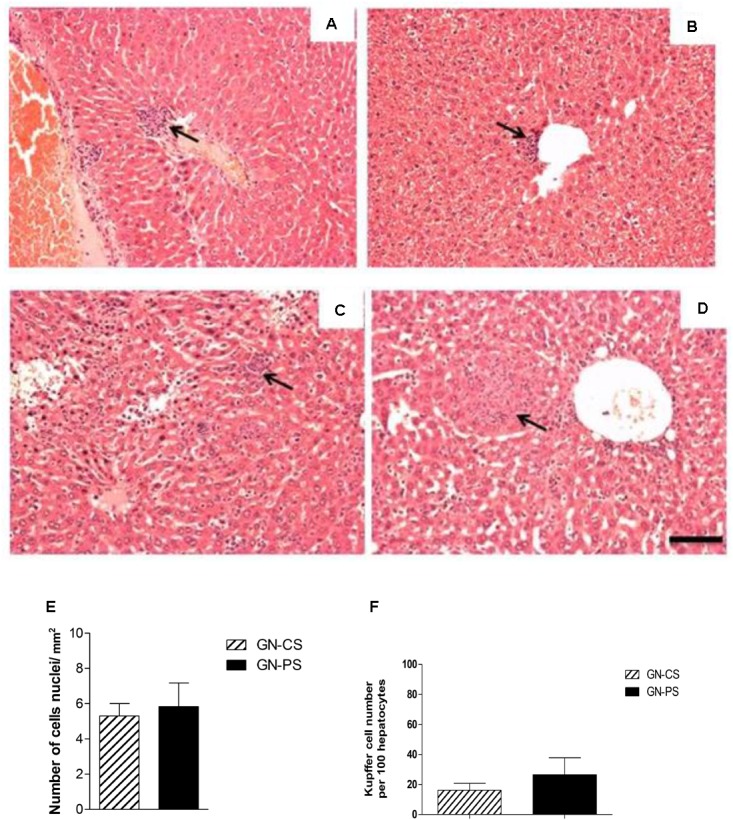
FIGURE 5.

Histopathological aspect of liver from mice monoassociated with L. diolivorans 1Z (GN-PS) or not (GN-CS) and challenged with S. Typhimurium. (A) GN-CS 2d, and (B) GN-PS 2d, animals sacrificed after 2 days of infection; (C) GN-CS 8d and (D) GN-PS 8d, animals sacrificed after 8 days of infection. Arrows indicate areas of inflammatory infiltrate. H&E, scale bar represents 100 μm. (E) Liver cellularity (cells nuclei/mm2), and (F) number of Küpffer cells per 100 hepatocytes in the animal liver of mice monoassociated (GN-PS) or not (GN-CS) with L. diolivorans 1Z and challenged with S. Typhimurium. The samples were taken at day 8 postinfection. The symbol “∗” indicates statistical difference between the groups GN-CS and GN-PS (ANOVA followed by Tukey test; P < 0.05).
