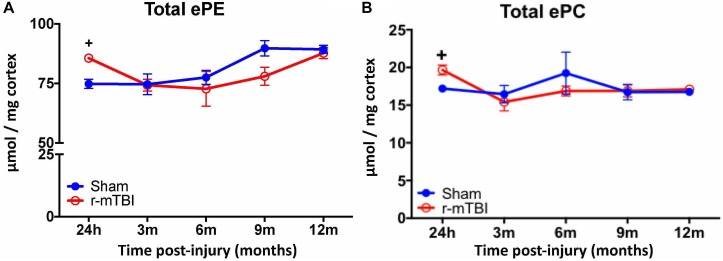
FIGURE 3.
Total ether PE and ether PC levels in the cortex of repetitive-mTBI hTau mice. Significant changes in total etherPE (A) and etherPC (B) lipid species in the cortex of a model of repetitive-mTBI in hTau mice. Sample size for all groups across all time points is n = 4. All data represent mean μM per (10 mg) wet weight ±SEM. Individual molecular lipid species were quantified by liquid chromatography/mass spectrometry and were summed after LipidomeDB analyses to generate total etherphospholipid levels. Asterisks represent +P < 0.05 for comparisons between sham/r-mTBI mice. ePE, etherphosphatidylethanolamine; ePC, etherphosphatidylcholine.

